Sports Info Solutions
Category: Baseball
-
Which Batters Have Changed Their Hard-Hit Rate The Most?
By
Evaluating the biggest changes in contact quality from 2018 to 2019.
-
Jeff McNeil’s excellence is multi-faceted
By
A look at some of the qualities in Jeff McNeil’s game that make him distinct.
-
New podcast: John Dewan & Ben Lindbergh + Midseason Review
By
Our latest baseball podcast touches on history and the new book, The MVP Machine
-
Which teams allow hard-hit balls least often?
By
Taking a peek at which teams limit hard contact the best.
-
MLB Leaderboard: Who allows hard contact least often?
By
Stephen Strasburg tops the rankings in this stat. There will definitely be some surprises on this list.
-
MLB Leaderboard: Which teams hit the ball hard most often?
By
Taking a look at which offenses are crushing the ball consistently.
-
MLB Leaderboard: Who’s hitting it hard most often?
By
Cody Bellinger tops the list. One of his Dodgers teammates figures prominently as well.
-
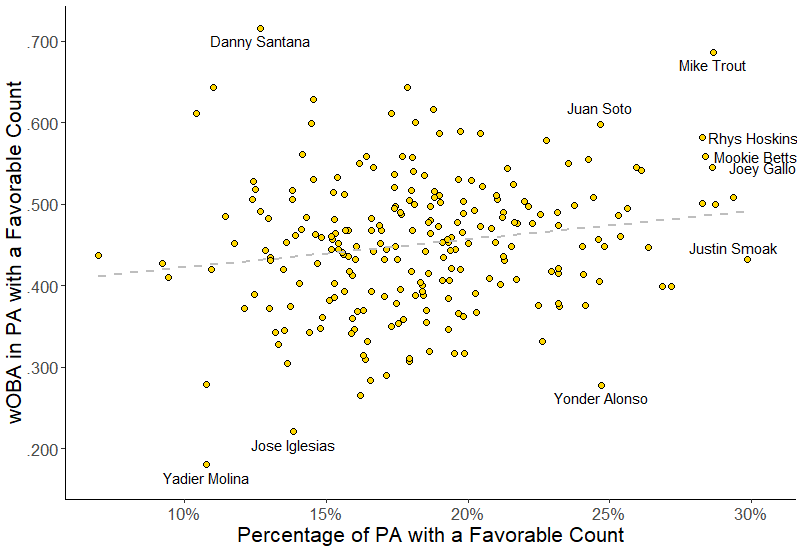
Which hitters reach favorable counts?
By
Which hitters get into favorable counts, like 2-0, 3-0, and 3-1? And which hitters then do damage?
-
What’s The Deal With Bryce Harper?
By
The $330 million man hasn’t quite lived up to expectations in his first season in Philly.
-
Which Teams Are Best at Drafting, Developing and Displaying DRS?
By
How has your favorite team fared at developing defense?