Sports Info Solutions
Category: MLB
-
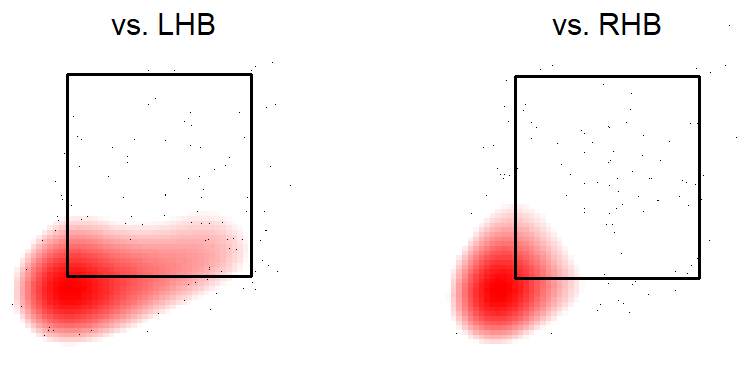
Hey, Nicholas Castellanos: Don’t be such a grump about analytics!
By
Castellanos has improved a lot on balls hit to deep right field.
-
What makes Mike Soroka and Max Fried so good?
By
The NL East-leading Braves have two guys with nasty pitches.
-
Stat of the Week: Bellinger, Trout battle for Total Runs lead
By
The 2 stars will likely be battling until season’s end to see who comes out on top.
-
How does Victor Robles have 15 Defensive Runs Saved?
By
By MARK SIMON Milwaukee Brewers center fielder Lorenzo Cain leads all players at the position with 18 Defensive Runs Saved. But the player who ranks second might surprise you. It’s not Kevin Kiermaier or Byron Buxton. It’s Victor Robles of the Washington Nationals. What has made Robles a standout is not just how he fares at…
-
What if Players’ Weekend nicknames were about their stats?
By
“El Mago” can stay, but how about: “Don’t Shift Me,” “$teal HR,” “Superman” and “BatBreaker?”
-
Stat of the Week: World’s No. 1 Starting Pitcher
By
Max Scherzer and Justin Verlander are dueling for the top spot.
-
New baseball podcast: Talking with a top prospect
By
Future Pirates third baseman Ke’Bryan Hayes gives us perspective on the challenges he face, what scouting is like, and much more.
-
How does Mike Tauchman have 14 Defensive Runs Saved?
By
What are the different components that make Tauchman such a good outfielder?
-
What Happened to JaCoby Jones’ Defense?
By
By Lindsay Zeck In 2018, JaCoby Jones led all outfielders in Defensive Runs Saved with 21. He was featured in a blog last October as a multi-position standout with his 11 runs saved in 452 innings in left field and 10 in 558 innings in center field. This season, however, he cost the Tigers 13…
-
Joe Panik: Not a big deal, however …
By
Perhaps there’s more to know about Joe Panik than his basic stats.