Sports Info Solutions
Category: NFL
-
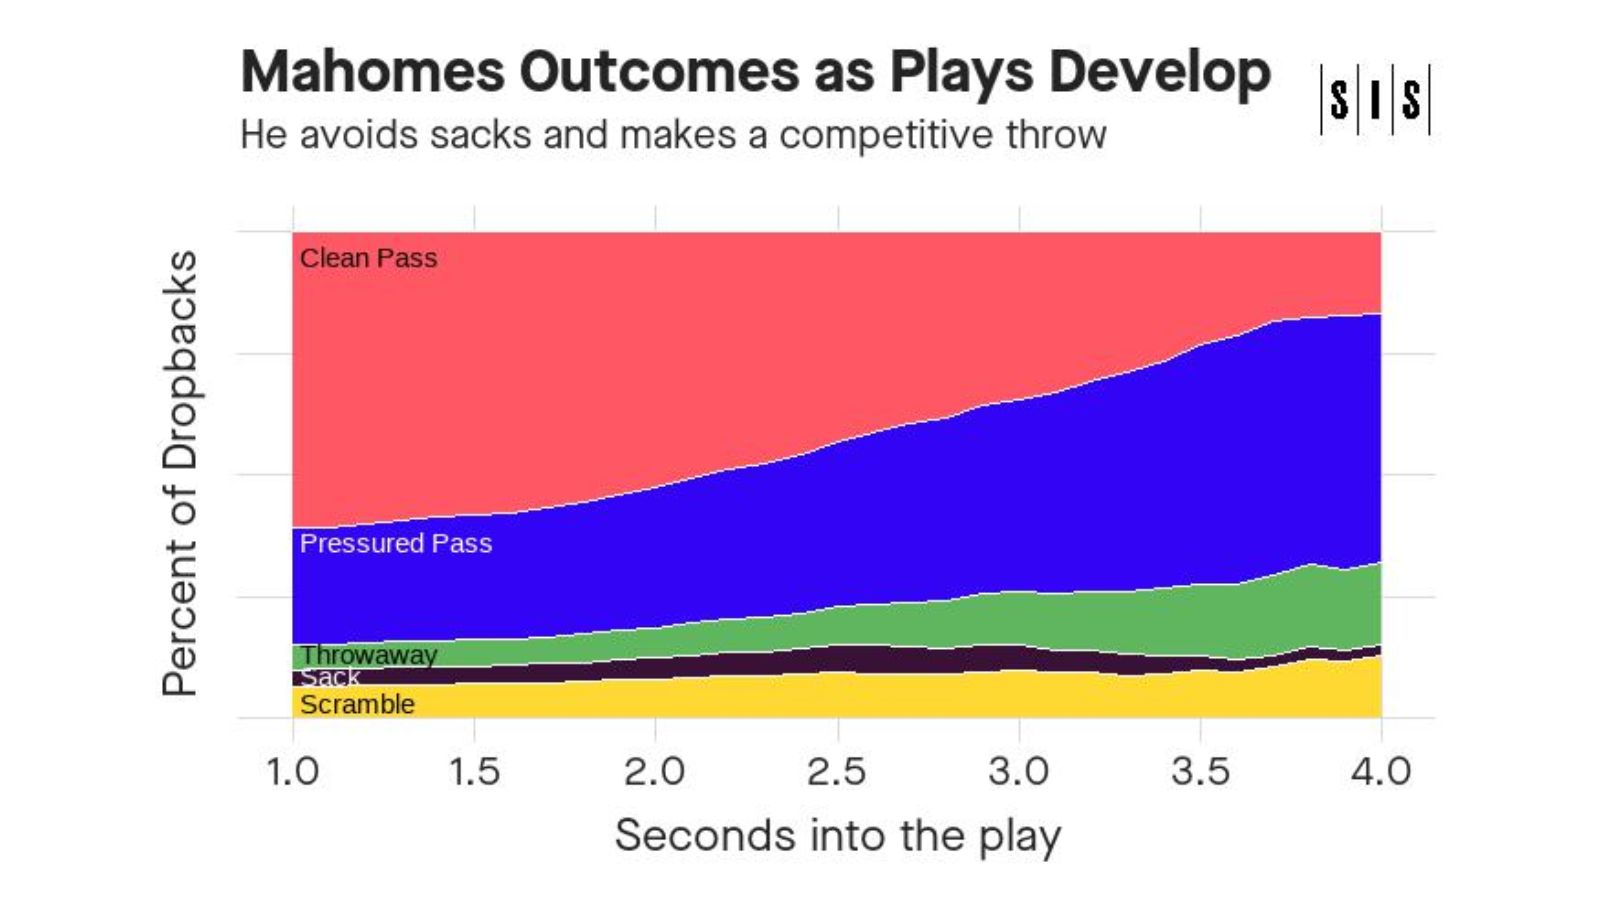
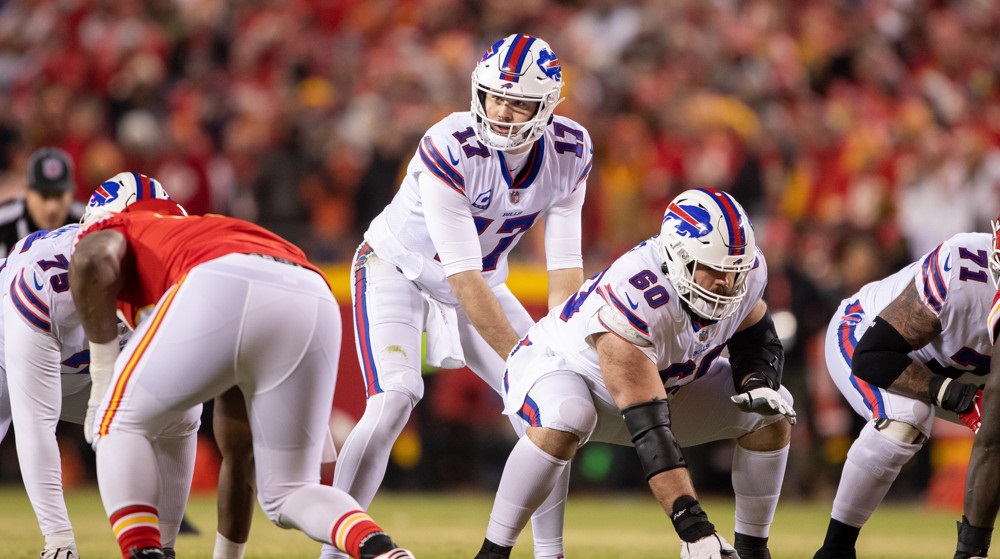
How the Super Bowl QBs Handle the Pocket Differently
By
Both bring all sorts of skills to the table but they operate differently when plays run long.
-
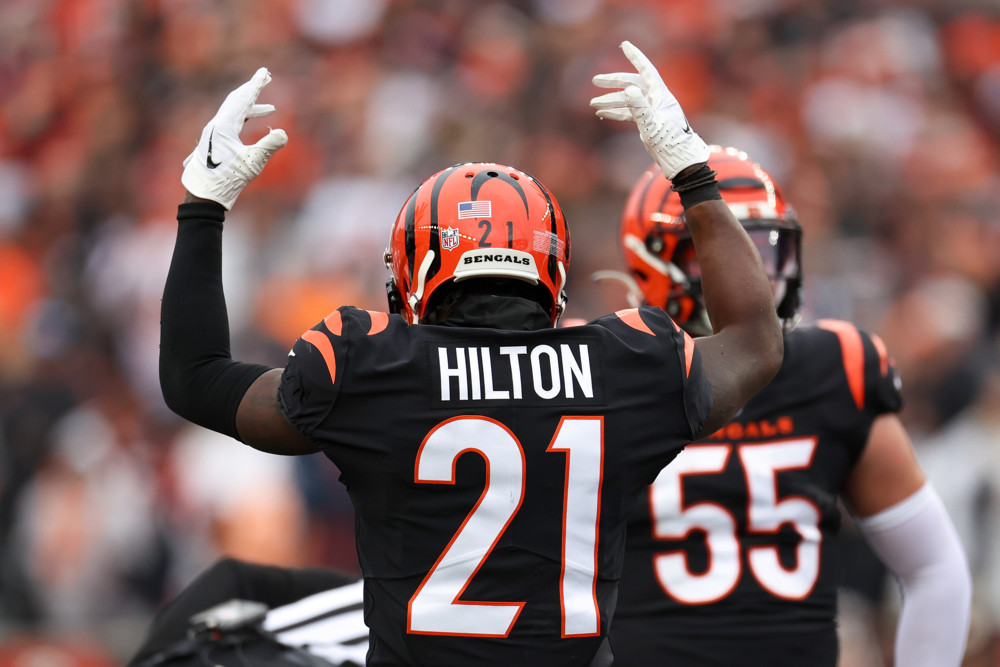
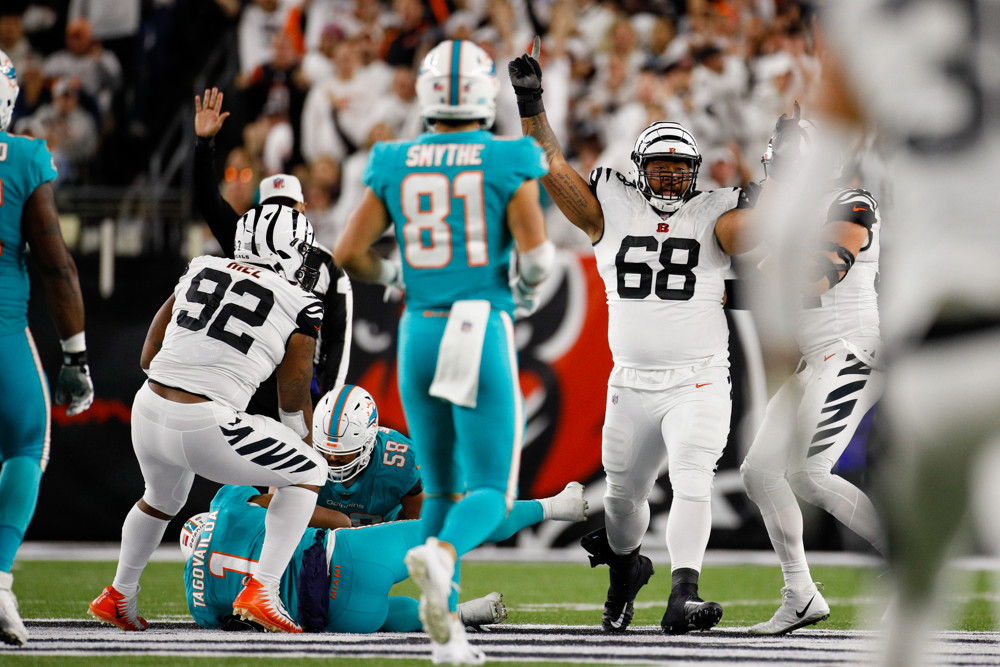
Who’s Up, Who’s Down Heading Into Conference Championships?
By
Mike Hilton and Cam Taylor-Britt are getting it done for the Bengals. We go through each team looking for those trending one way or the other.
-
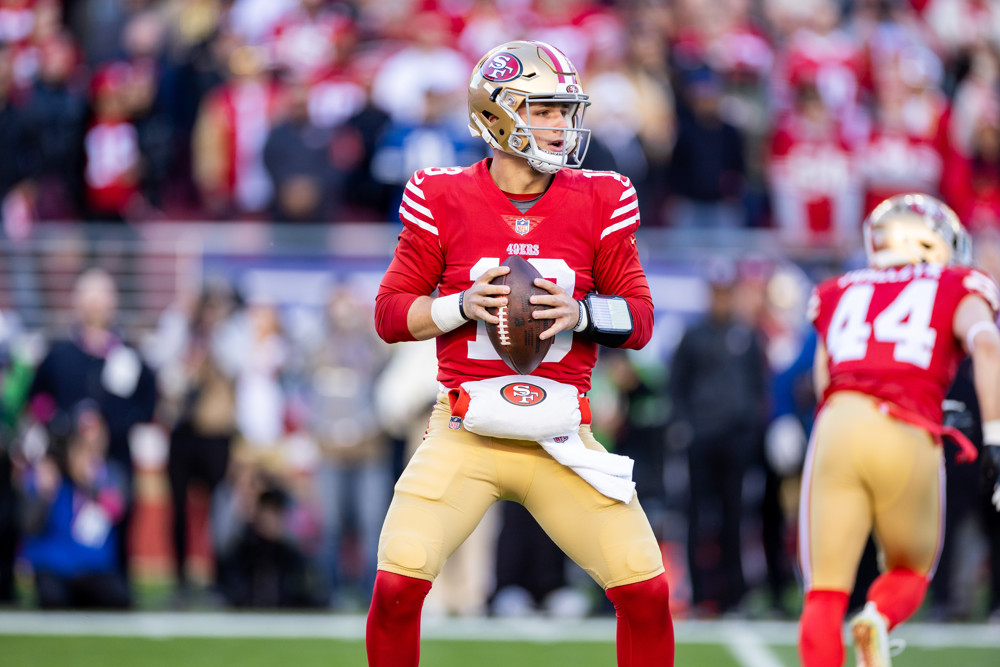
5 Observations About Brock Purdy
By
On intermediate passes, the many challenges the Eagles present, and more
-
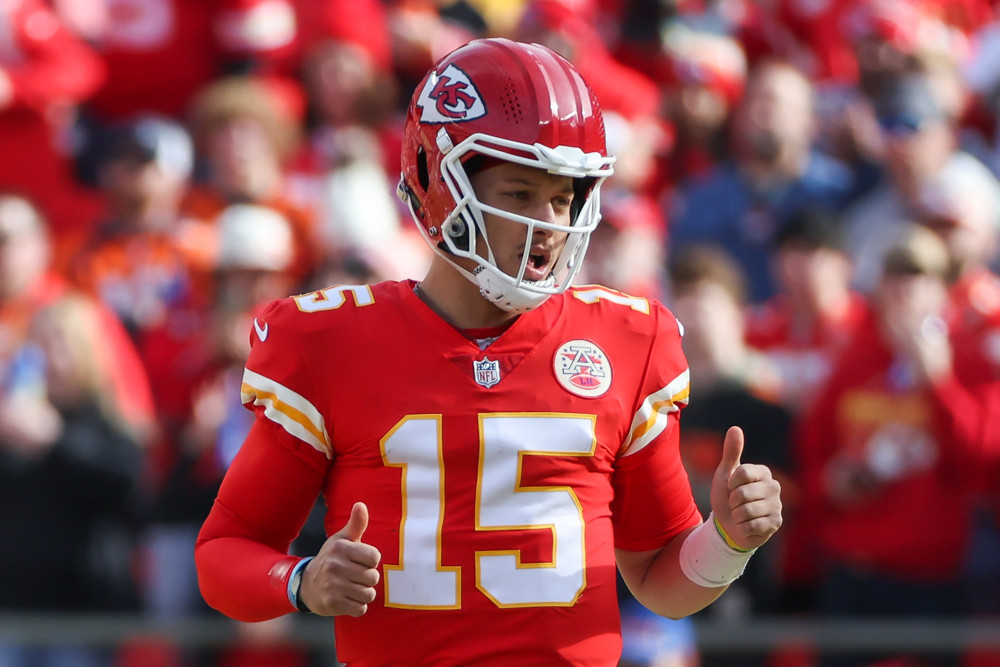
Stat of the Week: NFL’s Top Quarterbacks
By
Patrick Mahomes heads the list by a wide margin. Who had Jalen Hurts, Trevor Lawrence, and Jared Goff as being in the Top 6?
-
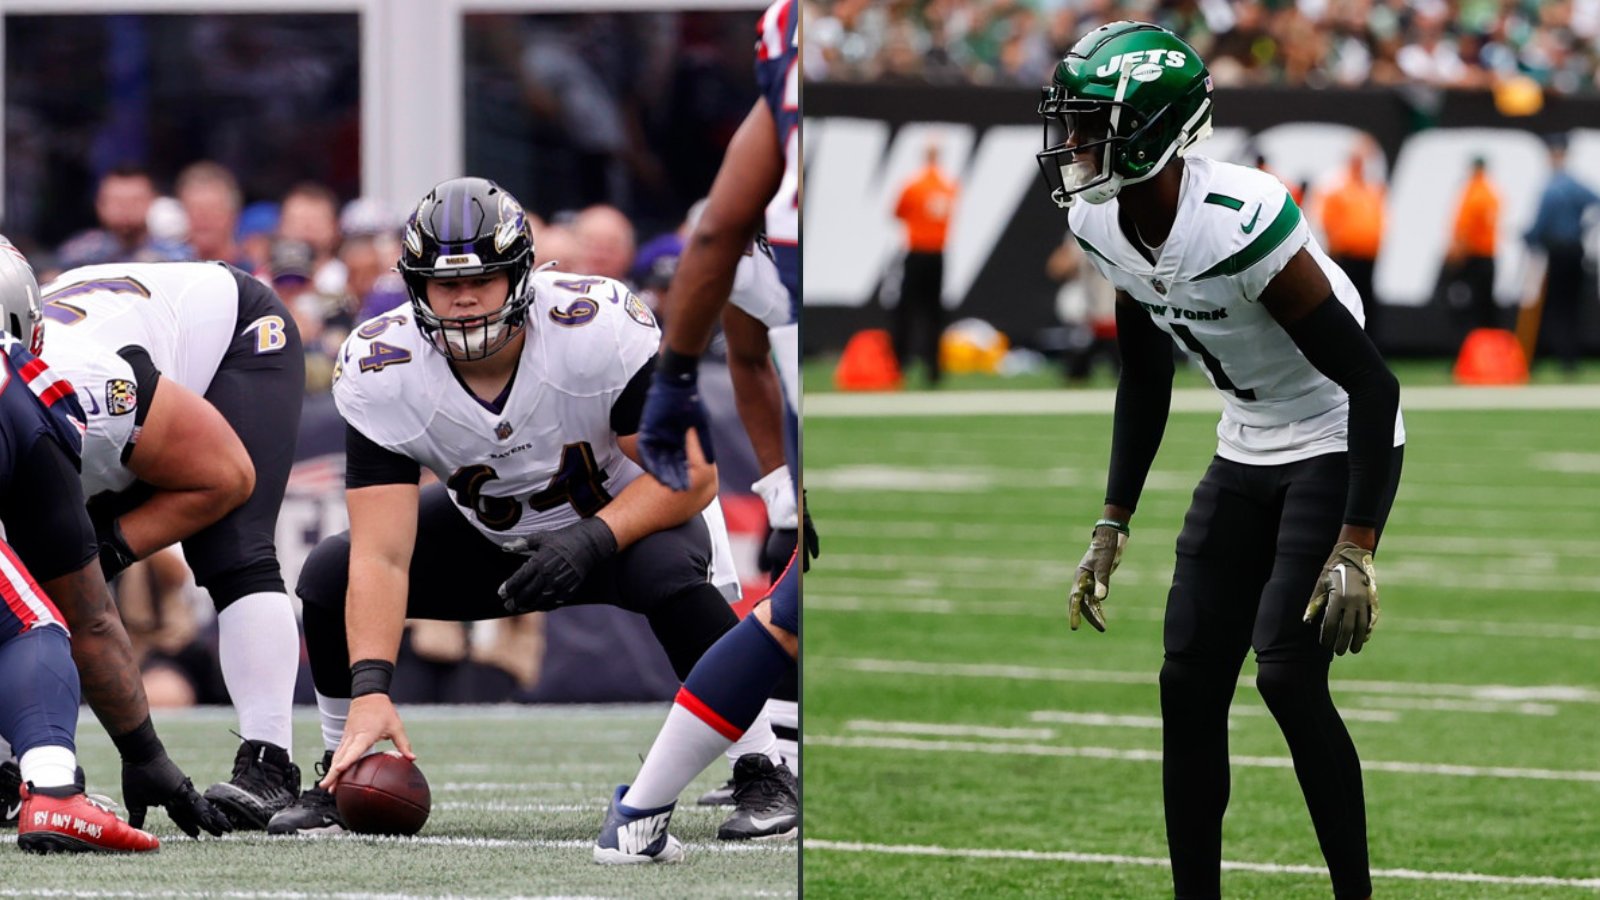
Sports Info Solutions 2022 NFL All-Rookie Teams
By
Tyler Linderbaum and Sauce Gardner were easy picks. But not every choice was an easy one. Check out who we selected.
-
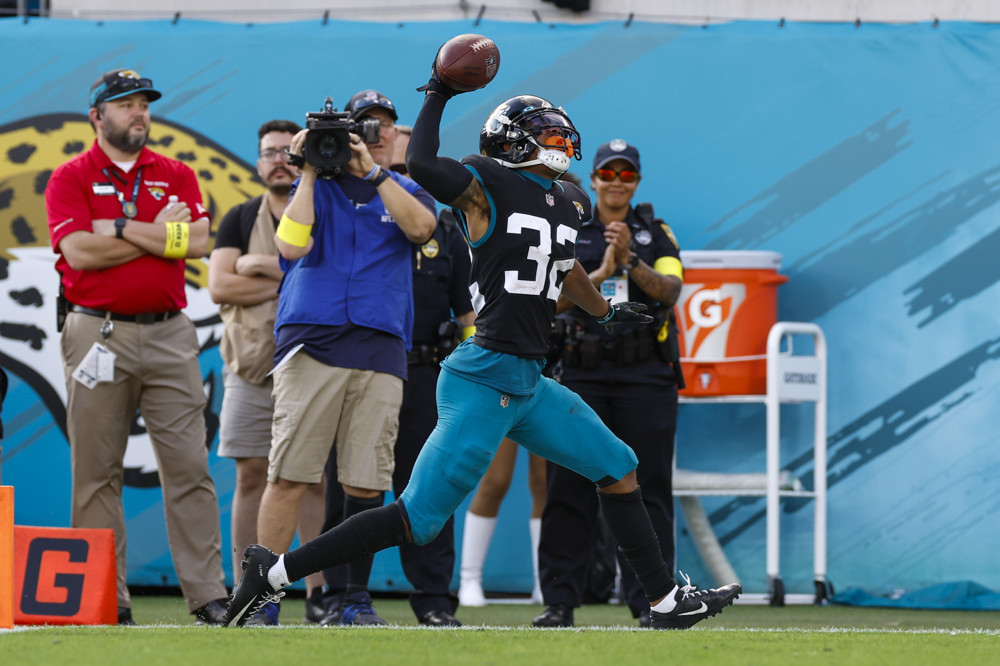
Snub Season: Who Should Have Made The Pro Bowl
By
Tyson Campbell is at the front of the list of players not selected who merited the honor.
-
The Effect of Turf On Injuries In The NFL
By
We looked at whether artificial turf impacts injuries, how much it does, and which parts of the body are most often impacted.
-
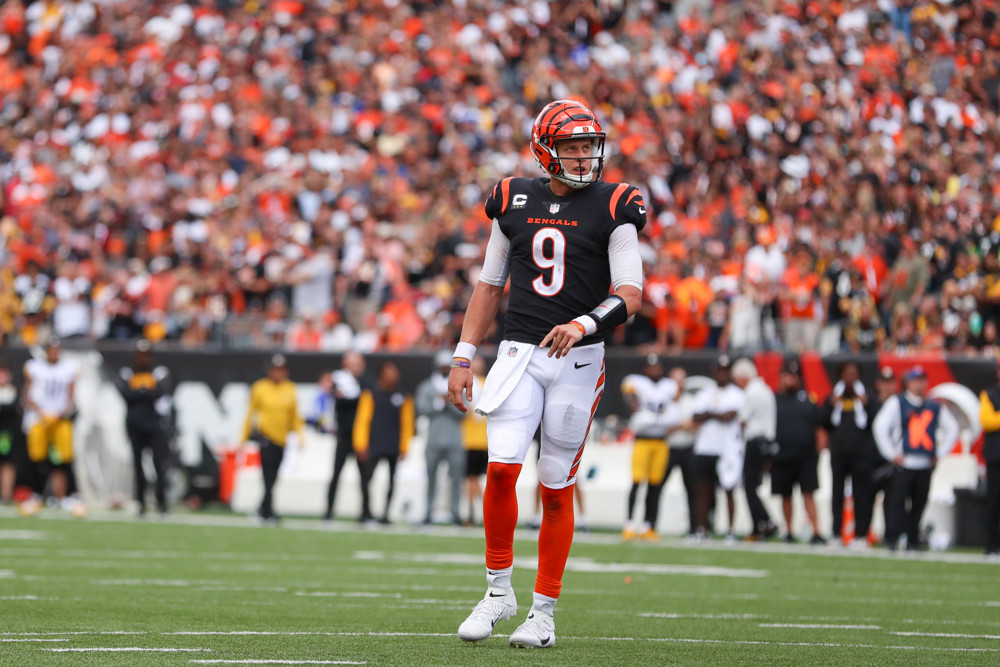
What’s Wrong With Joe Burrow And The Bengals Offense?
By
The Bengals have the talent to turn things around, but they’d better do so quickly, lest their window closes.
-
World’s No. 1 QB Rankings: Look Who’s No. 1!
By
It’s not Patrick Mahomes. It’s not Aaron Rodgers either.
-
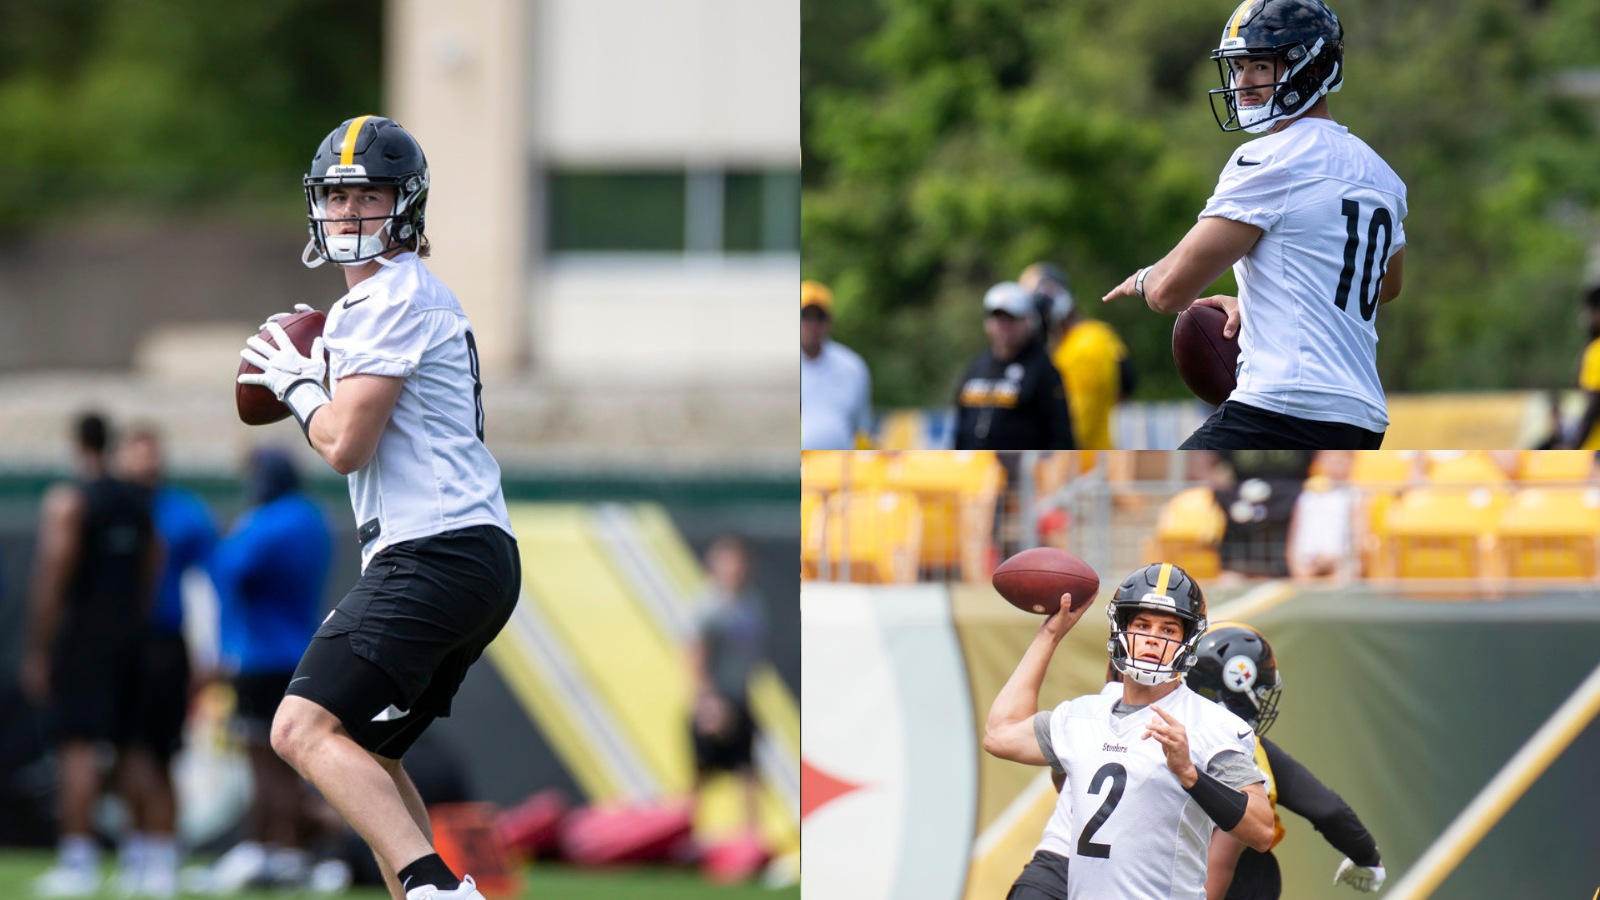
Which Steelers QB will start Week 1?
By
We review the 3 possible options to replace Ben Roethlisberger