Sports Info Solutions
Category: NFL
-
How Does Carson Schwesinger Fit With The Cleveland Browns?
By
He should be a plug-and-play LB with few limitations early on.
-
How Does Omarion Hampton Fit With The San Diego Chargers?
By
The Chargers would be wise to diversify their rushing gameplan to fit what Hampton does best.
-
How Malaki Starks Fits With The Baltimore Ravens
By
Baltimore’s heavy use of Nickel and Dime personnel, as well as two-high shells, require smart, physical, and instinctive players. And Starks is one.
-
10 Facts About NFL Schedule Trends
By
Things you’ve thought about but didn’t know … and maybe you want to know.
-
Future First Round Pick Trades Are Back In The NFL Draft!
By
Teams are more willing to trade next year’s first round pick than they should be, so we lay out a framework for how to evaluate whether such a deal makes sense.
-
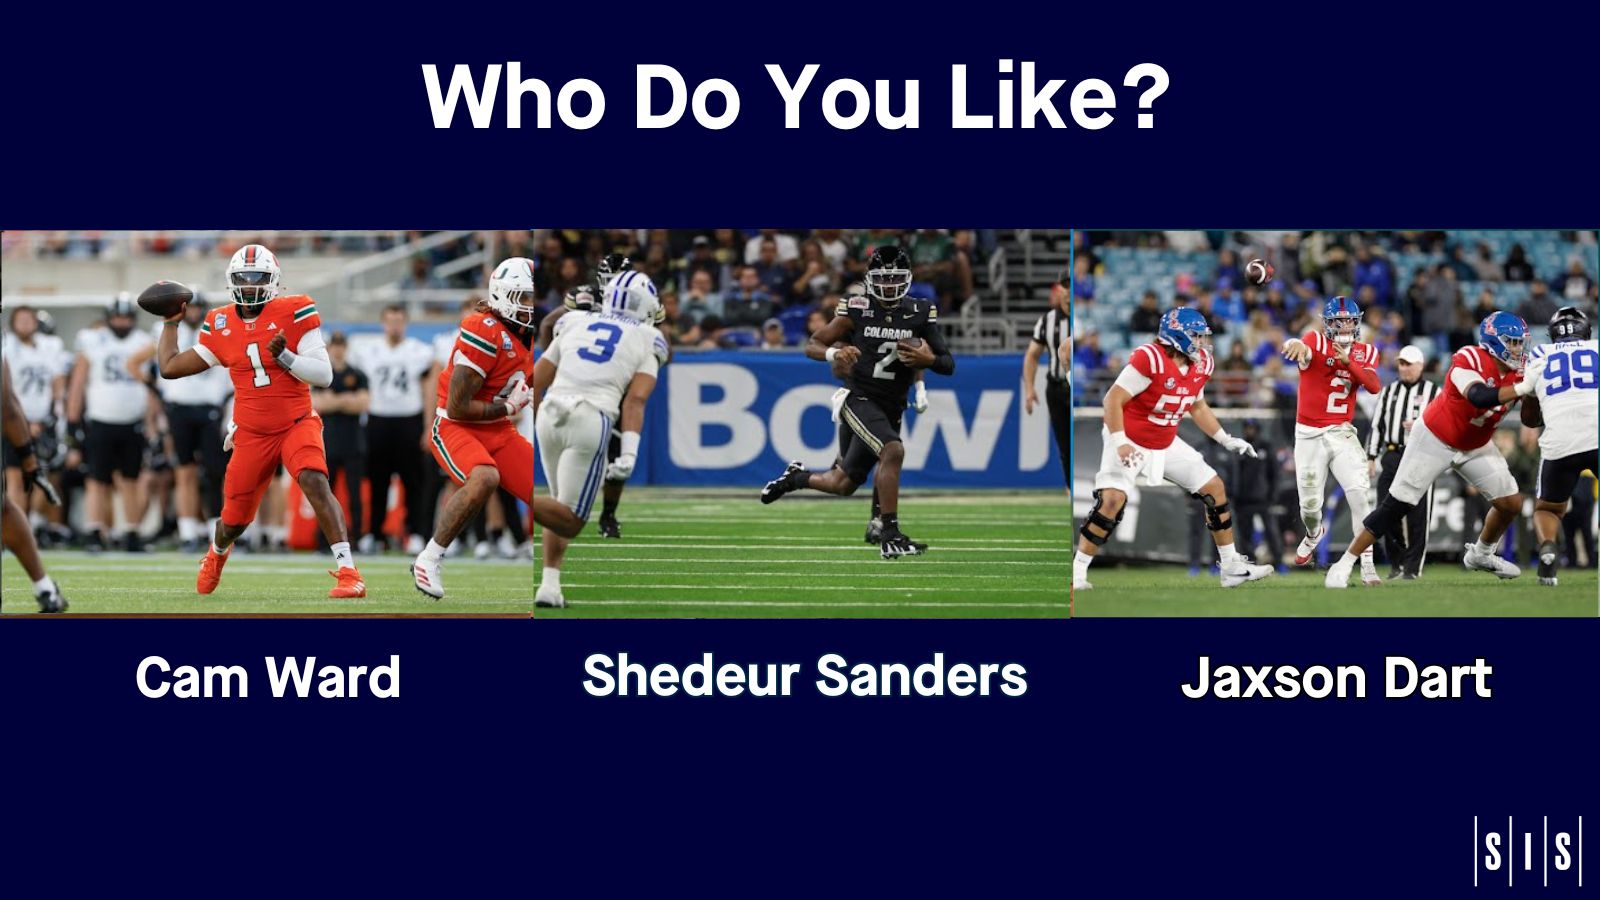
A Comparison of the Top 3 QBs in the 2025 NFL Draft Class
By
Who’s the best QB in the 2025 NFL Draft? Depends on your scheme.
-
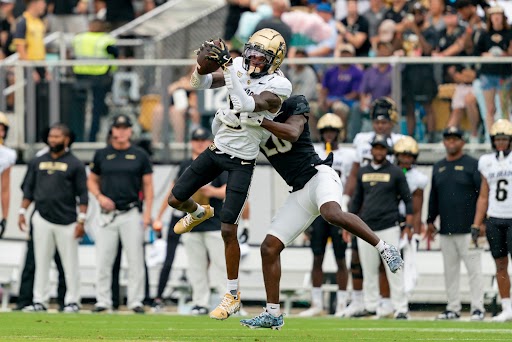
Analytics Scouting Report: Travis Hunter, Wide Receiver
By
We try to find where Hunter’s best part-time value can be applied on the offensive side of the ball
-
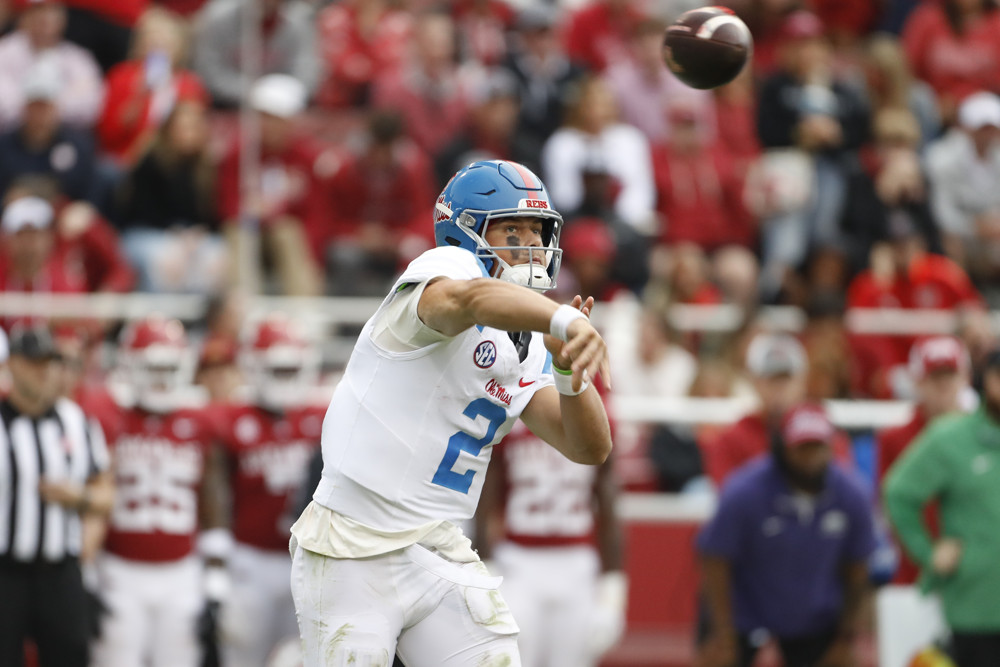
Evaluating How A Quarterback’s College Accuracy Projects To The NFL
By
Accuracy on intermediate throws had the strongest correlation with a quarterback’s overall performance when compared to deep or short passes. We share the details.
-
What Do Analytics Show For Edge Rushers In NFL Draft?
By
There may not be any blue-chip megastars in this group, but the numbers show there’s a lot of talent to be had.
-
New Podcast Episode: NFL Draft’s Top Defenders
By
“Abdul Carter has probably the highest ceiling in the entire draft …” Find out who else we like a lot among draft-eligible top defenders.