Month: August 2019

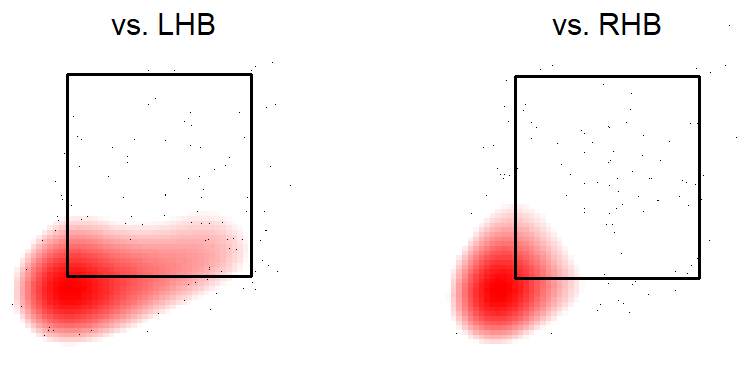
  • Hey, Nicholas Castellanos: Don’t be such a grump about analytics!

    By Mark Simon

    Chicago Cubs right fielder Nicholas Castellanos recently expressed his distaste for analytics in an interview with Bob Nightengale of USA Today.

    In a way, that’s unfortunate. The analytics show that Castellanos has made considerable defensive progress this season, his second full season playing right field.

    In 2018, Castellanos had about as rough a season in right field as any player did anywhere. He cost the Tigers 19 runs, almost entirely based in his struggles hit to the deepest part of ballparks.

    But this season, he’s fared far better at turning those balls into outs, thus taking away potential doubles and triples. Here’s the comparison:

    Balls Hit to Deepest Part of Right Field
    Year Plays Made Opportunities Plays Below Average
    2018 81 134 17
    2019 83 118 1

    Castellanos has gone from performing terribly on those balls to becoming an average fielder on them. He’s got a ways to go to be Cody Bellinger (80 plays made on 95 opportunities) but he’s improved to a reasonable level of adequacy.

    The improvement could be rooted in any number of things, with positional familiarity being the most likely. He’s also played a little deeper than he did last season — moving from an average starting position of 289 feet to 292 feet at Comerica Park, and playing 294 feet deep at Wrigley Field. The one or two steps he may have gained in this could be difference makers.

    Granted, Castellanos still has a ways to go. He’s cost his teams a combined six runs this season and his arm could use improvement in terms of baserunning deterrence. But the analytics are showing something positive for him, and perhaps giving him a reason to give them a chance.

  • What makes Mike Soroka and Max Fried so good?

    What makes Mike Soroka and Max Fried so good?

    By Brandon Tew

    Baseball in 2019 looks drastically different than it did five years ago. Now, hitters worry about launch angles and exit velocities. But this year’s efforts of Atlanta’s dynamic duo of Max Fried and Mike Soroka should worry Braves’ opponents.

    Fried and Soroka lead the Braves rotation with 14 and 10 wins, respectively. They also sit among MLB’s best in a stat that tries to combine launch angles and exit velocities into a quantifiable stat for hard-hit balls. The pair of young arms rank second and third in lowest rate of barrels allowed among pitchers with at least 350 batted ball events this season, with Fried allowing them at a 2.6% rate (15 barrels allowed) and Soroka 3% (18).

    MLB.com notes that the “barrel” classification is assigned to batted-ball events whose comparable hit types (in terms of exit velocity and launch angle) have led to a minimum .500 batting average and 1.500 slugging percentage since Statcast was implemented Major League wide in 2015.

    To be Barreled, a batted ball requires an exit velocity of at least 98 mph. At that speed, balls struck with a launch angle between 26-30 degrees always garner Barreled classification. For every mph over 98, the range of launch angles expands.”

    This stat helps quantifies the number of hard-hit balls on the bat’s “sweet spot.”  With the optimal launch angle and exit velocity, the ball usually goes for a base hit.

    Fried and Soroka minimize this with by allowing low launch angles. They rank second and third in the MLB in average Launch Angle with Fried at 3.5 degrees and Soroka at 4.9 degrees.

    So how has this Atlanta Braves pair missed so many barrels? They accomplish this in slightly different ways.

    How they do it

    Fried, a smooth throwing lefty, uses his four-seam fastball and a wicked curveball to keep hitters off-balance. With a lot of late-life on his fastball, Fried creates weak contact even in favorable counts to the batter.

    Soroka, a right-hander uses pinpoint command and a heavy sinker to induce weak contact. Soroka will throw his sinker at any time and keep hitters off of it with a slider away or four-seam fastball that comes up and in.

    Their different approaches embody the shift in pitching over the past five years, with Fried putting emphasis on a high-velocity four-seamer and good breaking pitch while Soroka favors the old-school pitching combo of a sinker and slider. Soroka pitches to contact and keeps the ball down in the zone.

    When you’re as adept at missing barrels as Fried and Soroka, you try to get ahead in the count and strike out batters or create soft contact, such as a weak ground ball. Both are great at producing ground balls. Soroka and Fried each have 53% ground ball rates, with Soroka ranking fourth and Fried sixth among ERA-title qualifiers.

    As for any pitcher, it is always best when you’re pitching ahead in the count to keep batters on the defensive so they can’t sit on one specific pitch, in one particular zone. First pitch strikes are a vital part of getting ahead in the count. They each are above MLB average of 61%, with Soroka at 64.6% and Fried at 63.7%

    Soroka pounds the arm-side bottom right corner of the zone with his sinker. He does this all game long. When behind in the count hitters have no choice but to either swing and probably make terrible contact or take the pitch for a strike. Hitters constantly smash his sinker into the ground. It’s a pitch that either runs under the hands of a right-handed batter or down and away from a lefty. Soroka also has the command to work this part of the strike zone.

    When he’s not throwing his sinker, he’s working the other side of the plate with his slider, throwing it down underneath the zone, making it almost impossible to square the ball up on this particular pitch.
    Soroka Slider
    Hitters are once again faced with the decision to swing and likely make a soft-contact grounder, or go fishing for a ball destined for the dirt. They’re hitting .136 when an at-bat against Soroka ends with this pitch. That ranks fifth-lowest in MLB among starting pitchers, behind Dinelson Lamet (.095), Justin Verlander (.112), Sonny Gray (.119), and Mike Cleveinger (.119).

    The heat map below shows how Fried utilizes his curveball to keep hitters guessing, while still throwing it in the zone often and inducing weak contact or missed swings. If hitters do connect, they generally swing over the top sending the ball darting towards the ground.
    Fried Curveball
    This also enables him to use his fastball more effectively. A fastball with so much late life  keeps hitters from making great contact with the heater. When  ahead in the count Fried can still be sporadic with his fastball command but he still stays inside the zone.

    What lends to Fried’s remarkable knack for missing the sweet spot of bats or getting a swing and a miss is the tunneling of both of these pitches and how they look so similar to the hitter and have late action to them. Fried can occasionally lose his release point and miss arm side and high with his fastball or hang his curve but when he’s on, he’s excellent at throwing both of these pitches from the same release point. making it hard to pick up which pitch is coming towards the batter.

    Why doesn’t Fried have as good of an ERA as Soroka? When hitters do get the ball in the air, they hit it out of the park. Fried’s home run to fly ball rate is 19%. Soroka’s is 8%. That may not entirely be Fried’s fault. Based on our expected stats (determined by the batted ball type, where the ball was hit, and how hard it is hit), Fried has allowed three more home runs than expected. Soroka has allowed three fewer.

    This one-two punch will be key for Atlanta down the stretch in the NL East. For them to continue racking up wins, Fried and Soroka will have to keep missing Barrels.

  • New football podcast: College Football Preview

    LISTEN HERE

    Former NFL scout Matt Manocherian (@mattmano) of Sports Info Solutions and football analytics pioneer Aaron Schatz (@FO_ASchatz) of Football Outsiders (@fboutsiders) welcome Brian Fremeau (@bcfremeau), creator of the College Football FEI Ratings, to the show to preview the 2019 NCAA Football season. The group explains the FEI Ratings (1:48) and then looks at each major conference to examine the top National Championship contenders, starting with the SEC (4:59) and moving to the ACC (9:31), Big Ten (14:30), Big 12 (17:49) and finishing up with the Pac 12 (22:20) before ending the show with College Football Playoff predictions (27:35).

  • New football podcast: Tough (Andrew) Luck

    LISTEN HERE

    Former NFL scout Matt Manocherian (@mattmano) of Sports Info Solutions and football analytics pioneer Aaron Schatz (@FO_ASchatz) of Football Outsiders (@fboutsiders) discuss the shocking retirement of Andrew Luck and what to expect from the 2019 Indianapolis Colts with Jacoby Brissett at the helm in this special mini-episode.

  • Stat of the Week: Bellinger, Trout battle for Total Runs lead

    By Mark Simon

    Which player has had the best season in baseball this year?

    That’s a very tough question to answer right now. Cody Bellinger of the Dodgers and Mike Trout of the Angels are basically neck-and-neck in Sports Info Solutions’ measuring stick, the Total Runs leaderboard.

    Total Runs is the sum of a player’s Runs Created (using Bill James’ formula), Defensive Runs Saved, and Baserunning Runs, along with a positional adjustment. The positional adjustment rewards a player for his playing time at a tougher position (for example, it’s harder to be an average shortstop than an average first baseman). For pitchers, Pitching Runs Created are included to account for how much a pitcher has limited opponent scoring.

    Trout has 122 Runs Created, one run better than Christian Yelich and six better than Bellinger. Trout’s edge over Bellinger stems from his big advantage in reaching base (.436 on-base percentage to .409). He also has a six-point edge in slugging percentage (.651 to .645).

    Trout is also eight Baserunning Runs better than Bellinger. He’s credited with six to Bellinger’s negative-two. Trout ranks first in Bill James’ Baserunning Gain stat (+25), which measures how often a runner takes an extra base on hits, wild pitches, and the like, while avoiding outs on the bases.

    Bellinger is hurt by below-average stolen base efficiency. He’s stolen 11-of-16 after stealing 14-of-15 a year ago. He’s also dinged for going second-to-home on a single only six times in 17 opportunities (a 35% rate — the MLB average is about 60%). Trout has scored 12 times from second on 16 singles (75%).

    Summing batting and baserunning gives Trout 128 runs and Bellinger 114 runs.

    Where Bellinger makes up the ground is on defense. His 23 Defensive Runs Saved are tied for most in the majors. Bellinger has taken to right field well in his first full-time season there. He has an MLB-best 19 Runs Saved there, with a combination of outstanding catches and assists (this one and this one are among the best). He also has three Runs Saved in 26 games at first base.

    Trout has saved two runs with his defense, down from eight in 2018. He’s been hindered by 15 Defensive Misplays & Errors as charted by our video scouts. That’s up from seven in 2018.

    Now Bellinger has the advantage, 137 to 130, with only the positional adjustment left to be made.

    Trout narrows the gap there. His adjustment is worth 20 runs. Bellinger’s is worth 15 runs.

    That gives Bellinger 152 Total Runs and Trout 150 Total Runs. Wow, it’s close.

    Here’s the current leaderboard. If you want to keep up to date with this race, follow along at Bill James Online by clicking here.

    Total Runs Leaderboard
    Player Team Total Runs
    Cody Bellinger Dodgers 152
    Mike Trout Angels 150
    Trevor Story Rockies 143
    Ketel Marte Diamondbacks 143
    Ronald Acuna Jr. Braves 138
    Christian Yelich Brewers 136
    Justin Verlander Astros 129
    Marcus Semien Athletics 129
    Mookie Betts Red Sox 129
    Alex Bregman Astros 129
  • Star College Quarterbacks: 5 You May Not Know

    By Corey March

    The most entertaining thing about college football is that with so many teams, there are star players out there that most people have never heard of.

    Depending on your level of college football fandom, you may know one or even all of these guys. But regardless, this article will hopefully add a new level of appreciation for these five standout quarterbacks.

    Nathan Rourke (Ohio, SR)

    Overview:

    Based on the numbers you are about to read, you’d think Nathan Rourke would be getting more attention as a draft prospect.

    Rourke, the 6’2”, 208 lbs senior, doesn’t quite measure up to the impressive physique of Josh Allen, but his style of play mirrors the former first-round pick with performance metrics to back up the comparison.

    This man is a menace to bring down once he takes off running, which he does about one-third of the time.

    His 6.4 yards/rush trailed only Kyler Murray among QBs with at least 100 rush attempts in 2018 and his 33% Broken Tackle rate was ranked No. 1. His Broken Tackle rate was still top-10 even with RBs factored back in. On 102 career attempts that came on designed runs and scrambles, Rourke is averaging 10.9 yards per carry – easily #1 over that span.

    His 36 rushing touchdowns trailed only Devin Singletary among all FBS players over the past two seasons.

    He also adds stellar contributions with his arm and isn’t afraid to push the ball downfield. His completions have traveled an average distance of 9.1 air yards. Over half of his deep ball attempts have been on-target.

    For those starting to come around on his draft stock, Rourke finished just behind Justin Herbert on the 2018 IQR leaderboard.

    Why he’s here:

    • Rushing Ability: The numbers speak for themselves, Rourke should be the favorite to produce the top rushing stats by a QB in 2019.
    • Dealing with Pressure: Last season, he posted the highest IQR rating the nation when under duress (128). He has also used pressure to his advantage at times as a runner, delivering 10.5 yards per rush on 22 scrambles caused by pressure in the last two seasons.

    Areas to improve:

    • Consistency: Last season, Rourke had three games where 80% of his passes were on target and three games where he was less than 60% accurate.
    • Performance vs Man Coverage: Rourke has been much more effective against Zone coverage (77% on-target, 64% completion in the last two seasons) compared to Man (57% on-target, 47% completion).


    Brock Purdy (Iowa State, SO)

    Overview:

    In a flash, Brock Purdy went from carrying a clipboard to carrying the 2018 Cyclones offense on an unexpected run to salvage bowl eligibility.

    Iowa State went into the 2018 season receiving a handful of top-25 votes and expecting to compete. Those feelings quickly dissipated after a lifeless offense sputtered to a 1-3 start.

    Purdy didn’t get the start the following week but saw the field for the first time after things had gotten off to another rocky start in Stillwater against a ranked Oklahoma State team. He seized the opportunity, not only leading the team to victory but leading the box score in passing and rushing yards.

    That was only the beginning for the freshman, who led Iowa State to wins in seven of its remaining nine games. After he became the starter, only Kyler Murray (10.9) and Tua Tagovailoa (10.5) averaged more passing yards per attempt than Purdy’s 10.3.

    That stat and that company are representative of Purdy’s arm strength, and accuracy. Comparing his stats again to Tagovailoa, the Alabama phenom barely edged him on deep ball accuracy (65% to 61%), but consider that 23% of Purdy throws traveled at least 20 air yards, while Tua was more involved in the short/intermediate game, going deep on 15% of his attempts.

     Why he’s here:

    • Deep Ball Accuracy: Among 57 QBs with at least 50 deep ball attempts, Purdy was the third-most accurate (77% on-target), while throwing deep at the second-highest rate (23% of total attempts).
    • Making Difficult Plays: Purdy was the only QB to finish the top-3 in the nation in both Yards per Pass Attempt on deep throws (18.8 Y/A) and throws under pressure (10.2 Y/A).

    Areas to improve:

    • Decision-making: His stats paint him as a capable runner (100/308/5) but with his passing prowess, the offense might benefit from Purdy taking off on less than 30% of his dropbacks. Seven interceptions compared to 15 touchdowns is also a ratio that Cyclones fans hope trends in a positive direction.
    • Spreading the ball around: How will he perform without his favorite target, Hakeem Butler? About one-third of Purdy’s targets and 56% of his completed air yards went to the Cyclone-turned-Arizona Cardinals receiver.


    Khalil Tate (Arizona, SR)

    Overview:

    We hope to see Khalil Tate, the runner, back on display in 2019.

    As a sophomore in 2017, Tate ran for as many as 327 yards in a game and eclipsed the 100-yard plateau in six straight games. He failed to follow that up, managing just 224 rushing yards all season and topping out at a single-game high of 46 yards.

    Last year, Tate suffered his first ankle injury in the Wildcats’ second game of the season – he left that game temporarily and was visibly affected when he returned. It’s important to note, his rushing performance in the Wildcats’ first game (8 rushes for 14 yards) would have represented his lowest rushing yardage total of the previous season – so it’s unlikely that the injury was the only factor at play. It was reported that first-year OC Noel Mazzone’s emphasis on pocket passing caused conflict with Tate and had the dual-threat QB considering options other than returning to Arizona for his final season.

    When the curtain closed on his junior season, Tate’s year-over-year run% had dropped from 44% to 19% and his percentage of throws from the pocket increased from 66% (lowest in FBS) to 86%.

    The latter was a positive adjustment considering Tate has been on-target with 72% of his throws from inside the pocket compared to 62% on throws from outside the tackle box.

    Why he’s here:

    • Aggressiveness: His passes have been caught at an average depth of 7.8 yards downfield and 26% of his throws traveled 20+ air yards (last two seasons).
    • Rushing Ability: His 9.2 yards per carry in 2017 is the highest QB mark in FBS in the three seasons of SIS data collection , however, this fell to 3.0 YPC in 2018.

    Areas to improve:

    • Accuracy: Tate posted a 71% on-target throw% on all throws and a rate of 52% on deep throws (last two seasons).
    • Clutch Performance: Tate has put up a 77 IQR on 125 pass attempts in the 4th quarter and a 79 IQR on 82 pass attempts in the second half of one-score games.


    Mason Fine (North Texas, SR)

    Overview:

    Mason Fine’s college career has been on a steady upward trajectory since he took his first snaps as a freshman. The fourth-year starter is on pace to become just the 18th FBS quarterback to crack the 13,000 passing yard mark.

    After an inauspicious first season, Fine has propelled the Mean Green to consecutive 9-win seasons and become the face of a program that recently captured some elusive recognition by grabbing three votes in the preseason Coaches Poll.

    Fine’s terrific past two seasons, combined with the efforts of the North Texas Athletics Department (6forheisman.com), have been the catalyst for some well-deserved hype as he enters his senior year.

    The pocket-passer delivered his highest TD total (31) as a sophomore but his 2018 junior campaign is the one that catapulted him onto the map. He opened the season in style, by throwing 21 touchdowns and just one interception in his first 10 games (compared to 12 INTs in his previous 10).

    Fine has thrown more passes than any other QB over the last two seasons and averaged an impressive 8.0 Y/A. North Texas figures to rely heavily on him again in 2019.

    Why he’s here:

    • Pure Passing Ability: Since taking over as the starter early on as a freshman, Fine has dropped back to pass more than anyone in the nation, and the Mean Green are 22-15 over that span. He’s been on target with 76% of his passes.
    • Annual Improvement: Fine’s critical stats have improved year-over-year. He started out throwing 1.2 TD per INT in 2016, then upped it to 2.1 (2017) and 5.4 (2018). As a result, his IQR has increased each year from 77 to 105 to 120.

    Areas to improve:

    • Off-Schedule Throws: His results from inside a clean pocket (82% on-target, 8.1 Y/A, 112 IQR) are far more impressive than his numbers when flushed from the pocket due to pressure (44% on-target, 5.4 Y/A, 74 IQR).
    • Playing from behind: Fine has shown a better ability to protect a lead than overcome a deficit. He’s thrown 46 TD/6 INT with a lead compared to 18 TD/18 INT when trailing. Luckily only 21% of his passes came from behind last season compared to 79% in year one.


    D’Eriq King (Houston, SR)

    Overview:

    D’Eriq King is the definition of a playmaker – to get a sense of that, look no further than the scoreboard. In his first full season as the Houston starter, the Cougars averaged 48 points per game prior to King suffering a torn meniscus.

    Aside from the injury shortened game, King contributed a minimum of 3 touchdowns in every contest, including 4 TDs in three games and at least 5 TDs in five games.

    The Cougars used play action on 49% of their plays (FBS average = 28%), as a savvy way to get an edge offensively. King used the deception to his advantage, registering a 131 IQR and completing passes at an average depth of 8.0 yards downfield.

    King will also beat you on the ground, averaging 8.3 Y/A (3rd-most) and 4.3 Yards After Contact per Attempt (1st) on designed runs and scrambles. To add to his running efficiently, King scored a rushing touchdown in every game he played last season.

    Houston is 11-7 the 18 games that King started over the last two seasons. The Cougars are otherwise 4-5 during that span.

    Why he’s here:

    • Downfield Passing: When it came to intermediate and deep passes, only Trevor Lawrence (133) posted a higher IQR than King (132).
    • Clutch Performance: King led the nation with a 140 IQR and 83% on-target rate on third downs. On the rare occasion that Houston allowed its opponents to hang around in a game last season, King threw more touchdowns (5) than incompletions (4) in the second half of one score games.

    Areas to improve:

    • Performance vs Zone Defense: King has been less explosive and more susceptible to mistakes against Zone coverage (10 TD/5 INT) compared to Man coverage (27 TD/2 INT).
    • Running Post-Injury: King has proven to be a weapon on the ground, so this is more of a situation to monitor. Coming off a surgically-repaired knee, will King be able to continue attacking opponents with the same level of versatility?

    For more information about Sports Info Solutions, visit our website. To learn more about the SIS DataHub Pro and register for a free trial, visit pro.sisdatahub.com.

  • How does Victor Robles have 15 Defensive Runs Saved?

    By MARK SIMON

    Milwaukee Brewers center fielder Lorenzo Cain leads all players at the position with 18 Defensive Runs Saved.

    But the player who ranks second might surprise you. It’s not Kevin Kiermaier or Byron Buxton. It’s Victor Robles of the Washington Nationals.

    What has made Robles a standout is not just how he fares at catching balls (though as we’ll note in a moment, he’s pretty good there), but the value of his arm as a baserunning deterrent. He leads all players with seven Outfield Arm Runs Saved.

    How does a player accumulate that many Runs Saved?

    Robles has allowed 48% of baserunners to advance on balls he’s fielded in center, a rate that is slightly better than the MLB average of 53%. The key is that Robles has erased 11 baserunners attempting to advance with throws that did not require a cutoff man. Only two other center fielders even have half that many (Ramon Laureano and Jackie Bradley Jr. have seven).

    Of the 11 baserunners, six were thrown out at second base, three at home plate (literally saving a run), and two at third base. Robles’ total was boosted by four assists in a six-day span in the middle of this month (including this one and this one). The values of those 11 plays make up most of those seven runs.

    Robles is adept in the field too, though not at the level of contemporaries like Cain, Kiermaier or Buxton. Robles’ six Range & Positioning Runs Saved isn’t bad though. It ranks tied for seventh among center fielders.

    Robles’ inventory of great plays in the field includes a wall-crasher to rob Addison Russell of an extra-base hit to preserve a one-run lead in the ninth inning against the Cubs on May 19. That ball had a 4% out probability based on how far and how hard it was hit. But most of Robles’ best work has come on shallow fly balls.

    Robles has played a modest center field at Nationals Park, relative to others who have played there this season. His average depth there is 313 feet (which is coincidentally the same as Cain), which is about two feet shallower than the average center fielder this season. The highlight-worthy catches come on the deep balls. The catches on shallow balls look routine for him but might not be for someone playing deeper.

    As such, Robles’ Range & Positioning rating on balls hit to the shallowest part of the outfield is better than his range rating on balls hit to the deepest part. He’s eight plays made above average on the former, tied with Bader for second in MLB.

    Jake Marisnick leads at nine plays above average on shallow balls. Not everyone can survive a below-average rating on deep balls, but Robles can because he makes so many plays on everything else and has the capability to throw out so many baserunners.

    Victor Robles – Plays Made Above Average (By Depth)
    Plays Made Opportunities Plays Above Average
    Shallow 63 95 8
    Medium 104 115 3
    Deep 84 117 -2
    * Opportunities = Balls on which the CF had a >0% chance of making the play
    * Read this as “Robles made 63 plays on 95 shallow opportunities. The average CF would have made 55 on those same opportunities.”

    Robles hasn’t hit like Juan Soto or Anthony Rendon, but the glove is keeping him on the field, and makes him a highly-valuable part of the Nationals’ playoff push. And a recognizable name among the top defensive center fielders in the game.

    To learn more about our defensive metrics, try the SIS Baseball Podcast. Click here for the link.

  • What if Players’ Weekend nicknames were about their stats?

    By MARK SIMON

    One of the fun things about Players’ Weekend is looking at the names on the back of the jerseys and learning the stories behind the choices. Players are allowed to customize those to whatever nickname or meaningful combination of words they want.

    For example: Oakland Athletics pitcher Mike Fiers is “Smokey.” Indians pitcher Shane Bieber is “Not Justin.” Rangers outfielder Hunter Pence is the shrug emoji, ¯_(ツ)_/¯, and injured Yankees outfielder Giancarlo Stanton is “Parmigiancarlo.”

    That got us to thinking: what if players picked their weekend nicknames based on their stats?

    What would be on the backs of those jerseys?

    Here are a few thoughts.

    Chicago Cubs, Javier Baez – “El Mago”

    Ok, so we’re totally cheating to start this off. But with Baez, that choice is way too obvious and gives us an excuse to share his stats.

    Baez ranks third among shortstops with 14 Defensive Runs Saved. He’s the best shortstop at converting double plays. And you’ve seen his great tags on the biggest stage (his quick hands are like a magician’s). Oh, and he also leads the majors in something we track called “Good Baserunning Plays,” which is basically what you think it would be. He has 10 in 2019.

    Kansas City Royals, Whit Merrifield – “Mr. Line Drive”

    It’s been a rough season for the Royals, but they do have someone near the top of the leaderboard in one stat. Utility man Merrifield earns his moniker, because his 29% line drive rate ranks first among batting title-qualifiers.

    Milwaukee Brewers, Lorenzo Cain – “$teal HR”

    We’re using the $ sign as Cain does for his weekend nickname, which is “3 Kid$.”

    Cain has been the best in the majors at robbing home runs both this season (4) and over the last three seasons (7). Honorable mentions to Josh Reddick and Adam Engel, who each have five.

    New York Mets, Jeff McNeil – “Don’t Shift Me!”

    McNeil has benefited as much from defensive shifts of any hitter, doing so by hitting the ball away from the defense. He’s batting an MLB-best .400 (26-for-65) when hitting a grounder or short liner versus a shift.

    New York Yankees, CC Sabathia – “The Bat Breaker”

    There are many ways we could have gone with the Yankees, but since it’s his final season and we want to show off the suite of stats we track, we go with Sabathia’s tendency to do damage to opposing lumber with his pitches.

    Sabathia has broken 53 bats by Sports Info Solutions’ count over the last four seasons. That’s easily the most in the majors.

    New York Yankees, Aaron Judge – “96.6”

    A shout-out to our friends at Statcast. Judge’s average exit velocity of 96.6 MPH leads the majors by 2 MPH over Nelson Cruz (94.5). That number is not far removed from his uniform number, 99.

    Oakland Athletics, Matt Chapman – “Down the Line”

    Chapman is arguably the game’s top defensive player. And what makes him great is in how he takes away would-be doubles down the third base line better than anyone else in the game.

    Chapman has 64 Defensive Runs Saved over the last three seasons, easily the most of any third baseman. He has more than twice as many as second-place Nolan Arenado (31). We thought about making his nickname “Brooks” after baseball legend Brooks Robinson, but he’s not quite ready for that just yet.

    Philadelphia Phillies, J.T. Realmuto – “Don’t Run on Me”

    Realmuto has eight Defensive Runs Saved for stolen base deterrence, easily the most in the majors. He’s thrown out 29-of-69 (42%), the best rate of his career and the best rate in MLB.

    Pittsburgh Pirates, Bryan Reynolds – “Keeler”

    This one is a nod to baseball history. It was Hall-of-Famer Wee Willie Keeler who coined the term “hit ’em where they ain’t.” No one has done that better than Reynolds, who leads the majors with a .398 BABIP this season.

    St. Louis Cardinals, Dakota Hudson – “You’re Grounded”

    This has nothing to do with parental punishment and everything to do with keeping baseballs from going airborne. Hudson leads the majors with a 58% ground ball rate.

    This also could have gone to Tampa Bay Rays pitcher Ryan Yarbrough, who has gotten outs on an MLB-best 82.5% of the ground balls and bunts hit against him.

    San Diego Padres, Austin Hedges – “The Framer”

    Hedges has had a phenomenal defensive season for the Padres. He leads all catchers in our Strike Zone Runs Saved stat, representative of the best catcher at getting his pitchers more strikes than expected this season.

    San Francisco Giants, Kevin Pillar – “Superman”

    Pillar is already known by this moniker to fans, especially those in Toronto. Over the last five seasons, he has the most diving, sliding and jumping catches in the majors (112). You can listen to him talk about this on a past edition of the Sports Info Solutions podcast.

    Tampa Bay Rays, Charlie Morton – “Captain Hook”

    Charlie Morton’s curveball has been one of the most valuable pitches in baseball this season, per FanGraphs’ run values.

    His former Astros teammate Collin McHugh will be wearing what Morton’s nickname could have been, “12 to 6.”

    Washington Nationals, Max Scherzer – “FIP to Be King”

    The Nationals ace, just back from injury, has used Players’ Weekend as a means of pointing out that he was one blue eye and one brown eye. We’ve changed his name to reflect his outstanding numbers with regards to strikeouts, walks and home runs allowed. He has the lowest FIP in the majors by more than half-a-run (2.18).

    For more notable stats from Sports Info Solutions, try our Stat of the Week.

  • New football podcast: Fantasy Football Risers & Fallers

    LISTEN HERE

    Former NFL scout Matt Manocherian (@mattmano) of Sports Info Solutions and football analytics pioneer Aaron Schatz (@FO_ASchatz) of Football Outsiders (@fboutsiders) welcome Corey March (@marchmadness26) back to the show to talk fantasy risers and fallers for the upcoming season.

    The trio examines the fantasy value of Andrew Luck (2:23), Lamar Jackson (7:29), Tony Pollard (10:06), the RB situation in Chicago (14:54), how to handle the Zeke and Gordon holdouts (16:53) and Kansas City backs (18:56). The episode closes with a look at the fantasy projections for a group of pass-catchers including Josh Gordon (24:11), Emmanuel Sanders (27:21), Curtis Samuel (28:31), Vance McDonald (30:25) and Jared Cook (33:24).

    For more, check out:

    sportsinfosolutions.com

    footballoutsiders.com

    sportsinfosolutionsblog.com

    SISDataHub.com

  • Stat of the Week: World’s No. 1 Starting Pitcher

    By Mark Simon

    Max Scherzer is returning to the Washington Nationals
    rotation on Thursday after missing nearly a month with a rhomboid muscle
    strain. This is just in time both for the Nationals’ playoff push and for
    Scherzer to try to regain his status as the top pitcher in Bill James’ World’s No. 1 Starting Pitcher Rankings.

    Scherzer, who had a 1.17 ERA in 10 starts prior to his injury, was the No. 1 starter in the rankings to begin the year. He had a small lead entering Wednesday, but Justin Verlander passed him with a great start in a loss to the Tigers.

    Here is the current top 10.

    Bill James World’s No. 1 Starting Pitcher Rankings
    Rank Name Team Current Score
    1 Justin Verlander Astros 550.3
    2 Max Scherzer Nationals 547.4
    3 Jacob deGrom Mets 522.6
    4 Gerrit Cole Astros 516.9
    5 Chris Sale Red Sox 504.3
    6 Clayton Kershaw Dodgers 497.0
    7 Zack Greinke Astros 490.9
    8 Aaron Nola Phillies 487.5
    9 Stephen Strasburg Nationals 486.1
    10 Patrick Corbin Nationals 486.0

    The rankings use a system devised by Bill James in which the primary
    component is a pitcher’s Game Score in each game he starts. Daily updates to the rankings and a comprehensive explanation of the methodology can be found
    here.

    Verlander has survived 33 home runs against him to post a 2.77 ERA. He has 14 starts with a Game Score of 70 or higher. No one else has more than 10. He’s one of three Astros pitchers in the top 10. The Nationals also have three pitchers in the top 10.

    Several pitchers have made big jumps to get into the top
    20 (first number indicates ranking entering March 20):

    Charlie Morton (from 34 to 12)
    Lance Lynn (66 to 13)
    Hyun-Jin Ryu (79 to 17)
    Sonny Gray (65 to 16)
    Luis Castillo (52 to 18)
    Walker Buehler (49 to 15)

    Charlie Morton’s ascent has come with a new team, as he signed with the Tampa Bay Rays this offseason. He’s used a dominant curveball to lead the AL with a 2.70 FIP and ranks second in the league with a 2.85 ERA.

    Lance Lynn is also a free agent signing that paid off for the Rangers. He has a 2.84 ERA in his last 18 starts. Hyun-Jin Ryu has a major-league-leading 1.64 ERA. He’s the healthiest he’s been in a long time, has shown a dominant chanegeup, and will likely make his most starts in a season since he had 30 in 2013.

    Sonny Gray had a rough time with the Yankees, but a trade to the Reds has done him good. His ERA is down nearly two full runs from 2018 to 2.92. His teammate, Luis Castillo, has also had a big drop in ERA thanks to one of the best changeups in baseball. Walker Buehler’s ERA is up from 2018, but he’s had two great starts to boost his score, a 16-strikeout complete game against the Rockies and a 15-strikeout complete game against the Padres.

    The pitcher who has slipped the furthest out of the top 10 is Corey Kluber, who dropped from No. 5 to 30 after missing most of the season with a fractured forearm. He was getting close to returning from injury, but had a recent setback. Kluber and Chris Sale (currently No. 5) may continue to drop due to their injury-related inactivity.

    For more baseball content, check out the Sports Info Solutions Blog or the SIS Baseball Podcast.