Sports Info Solutions
Author: Andrew Kyne
-
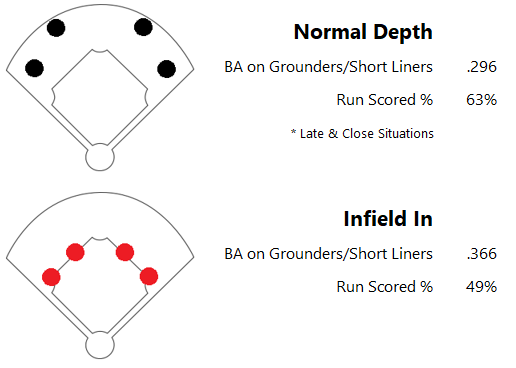
The Effectiveness of “Infield In” Defense
By
What do the numbers show about bringing the infield in?
-
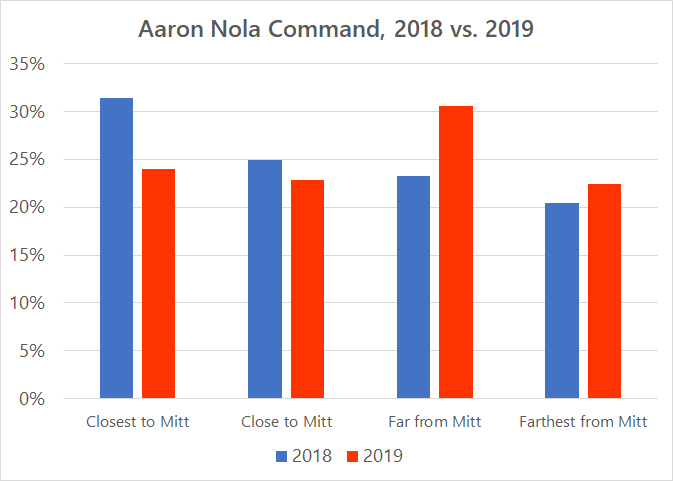
Quantifying Aaron Nola’s Early Season Command
By
A look at what our command charting metrics say about Aaron Nola’s slow start.
-
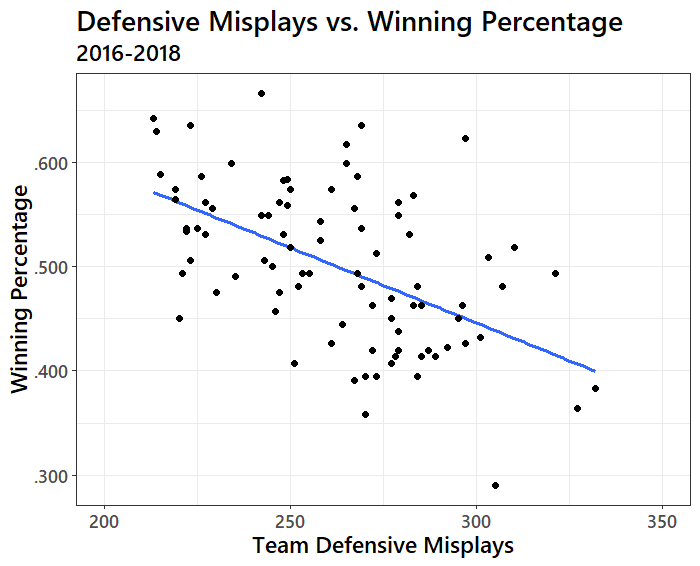
The Cost of Defensive Mistakes
By
The Mariners started the season at a torrid pace, but were one of the worst defensive teams in baseball. How do our Defensive Misplays correlate with winning?
-
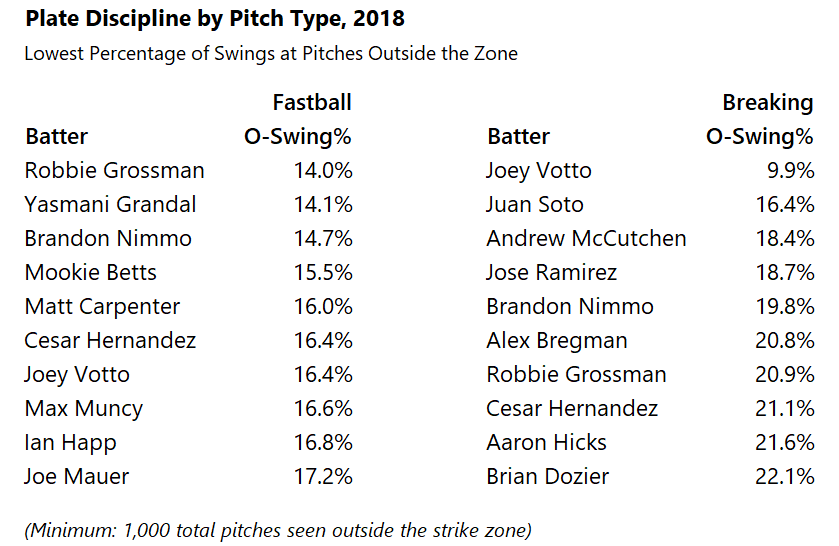
Breaking Down Plate Discipline by Pitch Type
By
Is Joey Votto’s greatness evident against both fastballs and breaking balls? Who else is that good?
-
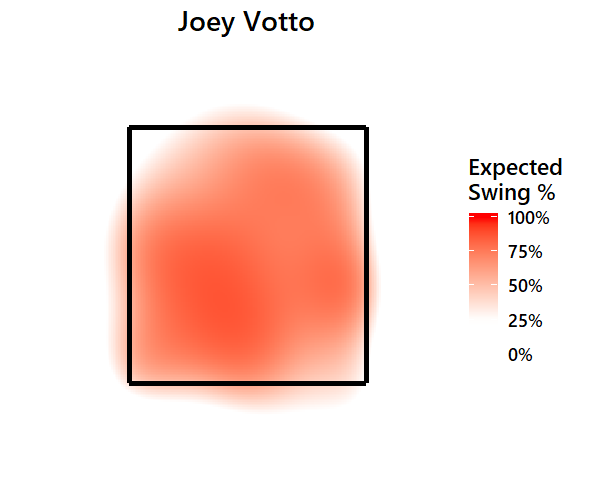
Visualizing Plate Discipline
By
We can put a number on plate discipline. But what does it look like? Where are hitters taking their swings, and how far do they extend their zones?
-
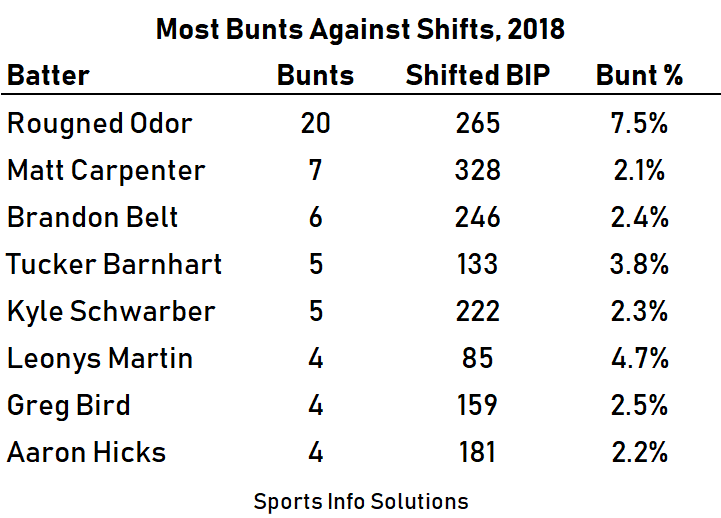
What we can learn from Rougned Odor’s bunts against the shift
By
Rougned Odor bunted against shifts far more than any other player. We watched them. Here’s what we learned.
-
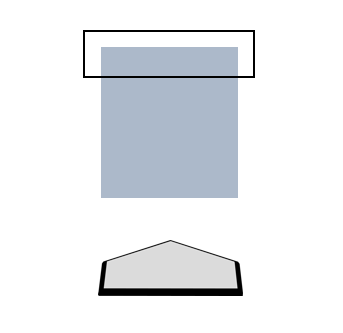
Which catchers get strikes at the top of the zone?
By
Robinson Chirinos has struggled to frame the high strike. Which catchers are best at getting strikes at the top of the zone?
-
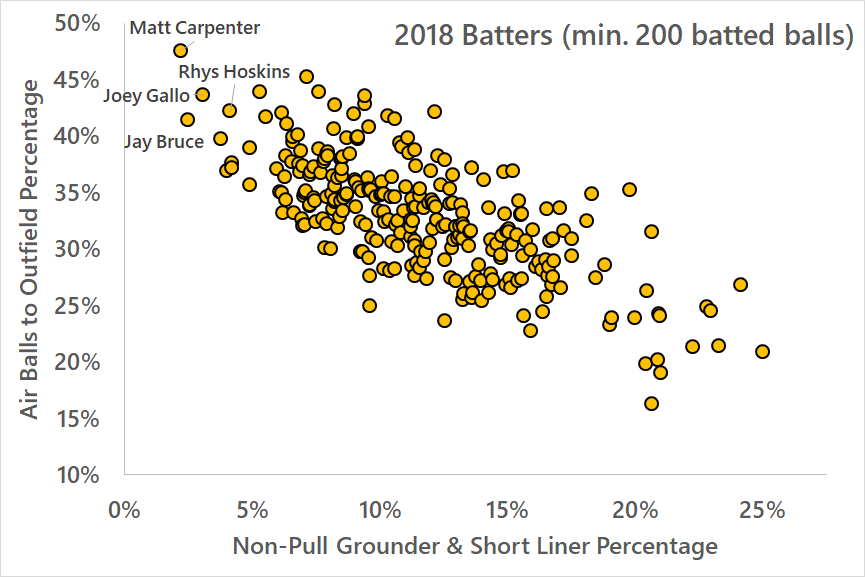
Finding Candidates for a Four-Man Outfield
By
Four-man outfields may be more common in 2019. Which hitters are candidates to face the strategy?
-
Stat of the Week: How Good is Kyler Murray?
By
By Sports Info Solutions Staff Last week’s Stat of the Week covered the SIS rankings and stats for the top players available in this year’s NFL Draft. There’s another player who generated headlines this week who was not at the top of those rankings. Oklahoma quarterback Kyler Murray announced he would pursue a career in the NFL…
-
Preview: NFC Divisional Round – Eagles vs. Saints
By
Notes on Drew Brees going deep, Nick Foles under pressure, and more.