Sports Info Solutions
Author: Bryce Rossler
-
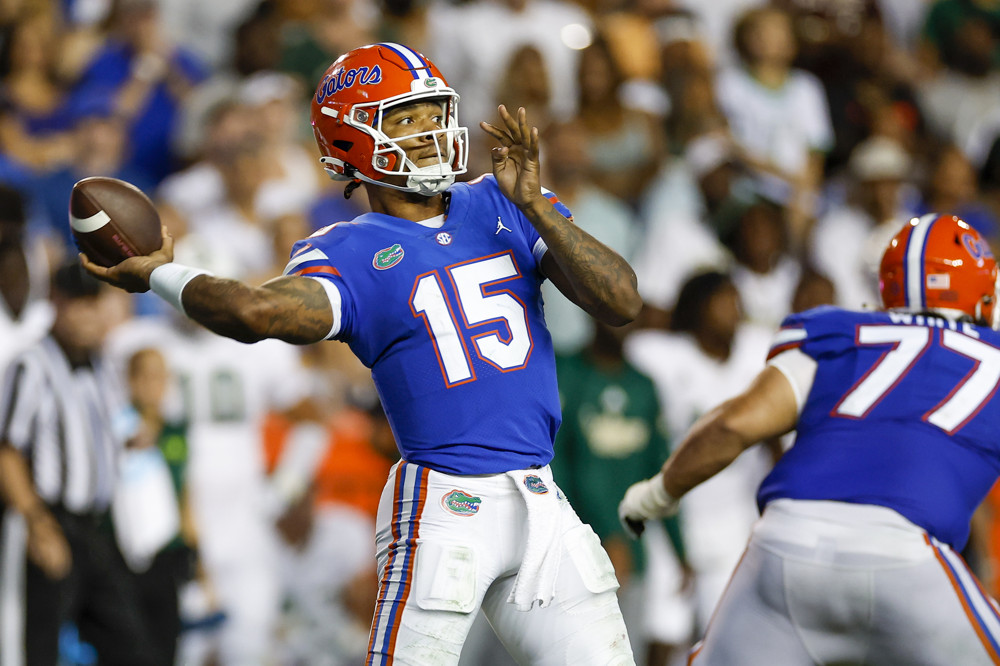
Anthony Richardson’s Accuracy: A Closer Look
By
A closer look at a QB with one big flaw – but better than several smaller ones
-
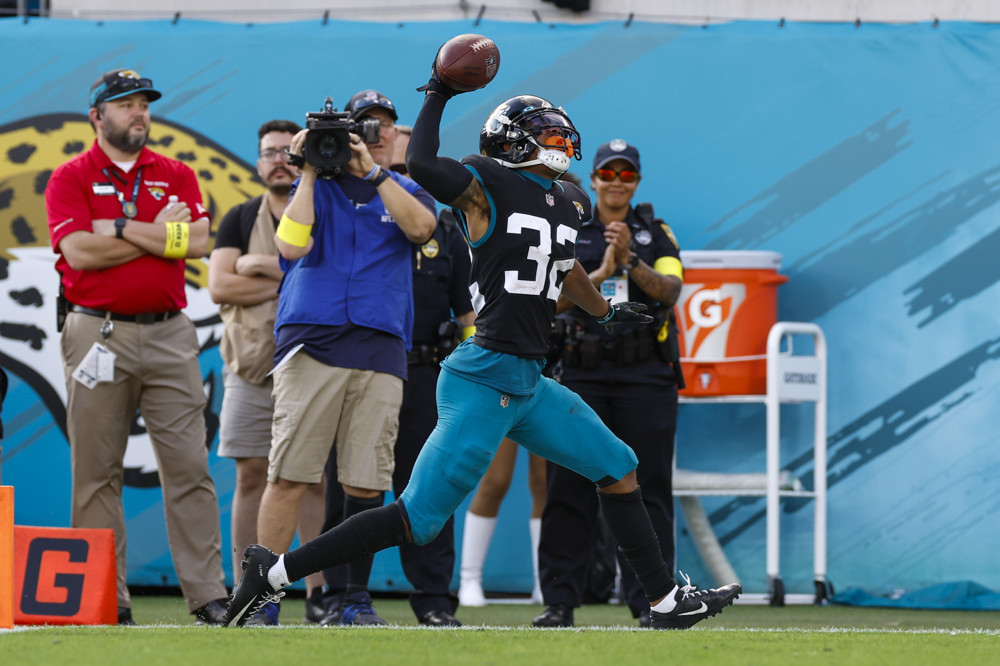
Snub Season: Who Should Have Made The Pro Bowl
By
Tyson Campbell is at the front of the list of players not selected who merited the honor.
-
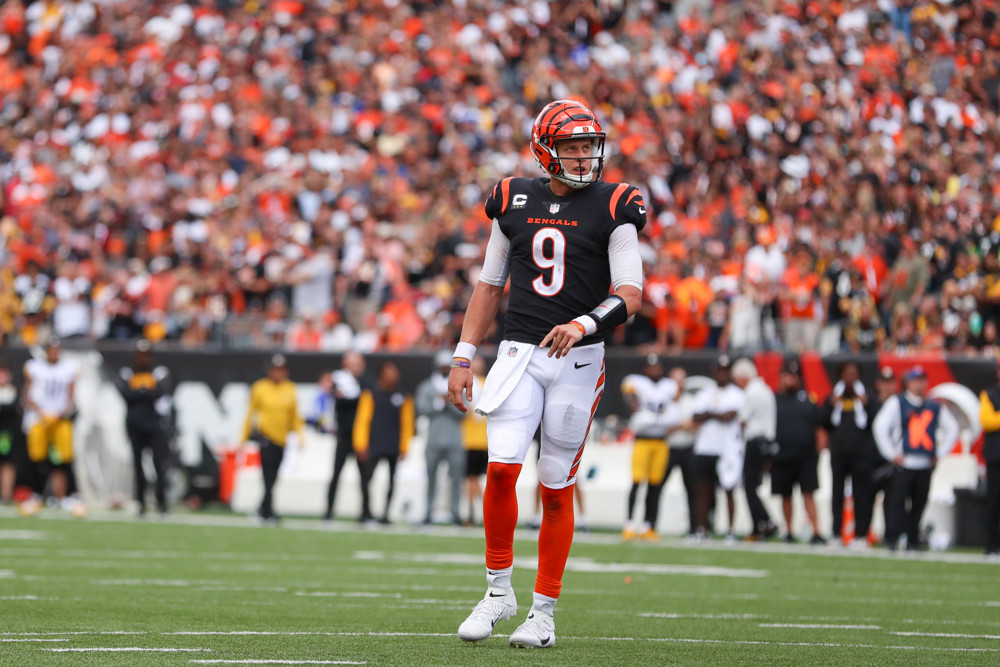
What’s Wrong With Joe Burrow And The Bengals Offense?
By
The Bengals have the talent to turn things around, but they’d better do so quickly, lest their window closes.
-
-
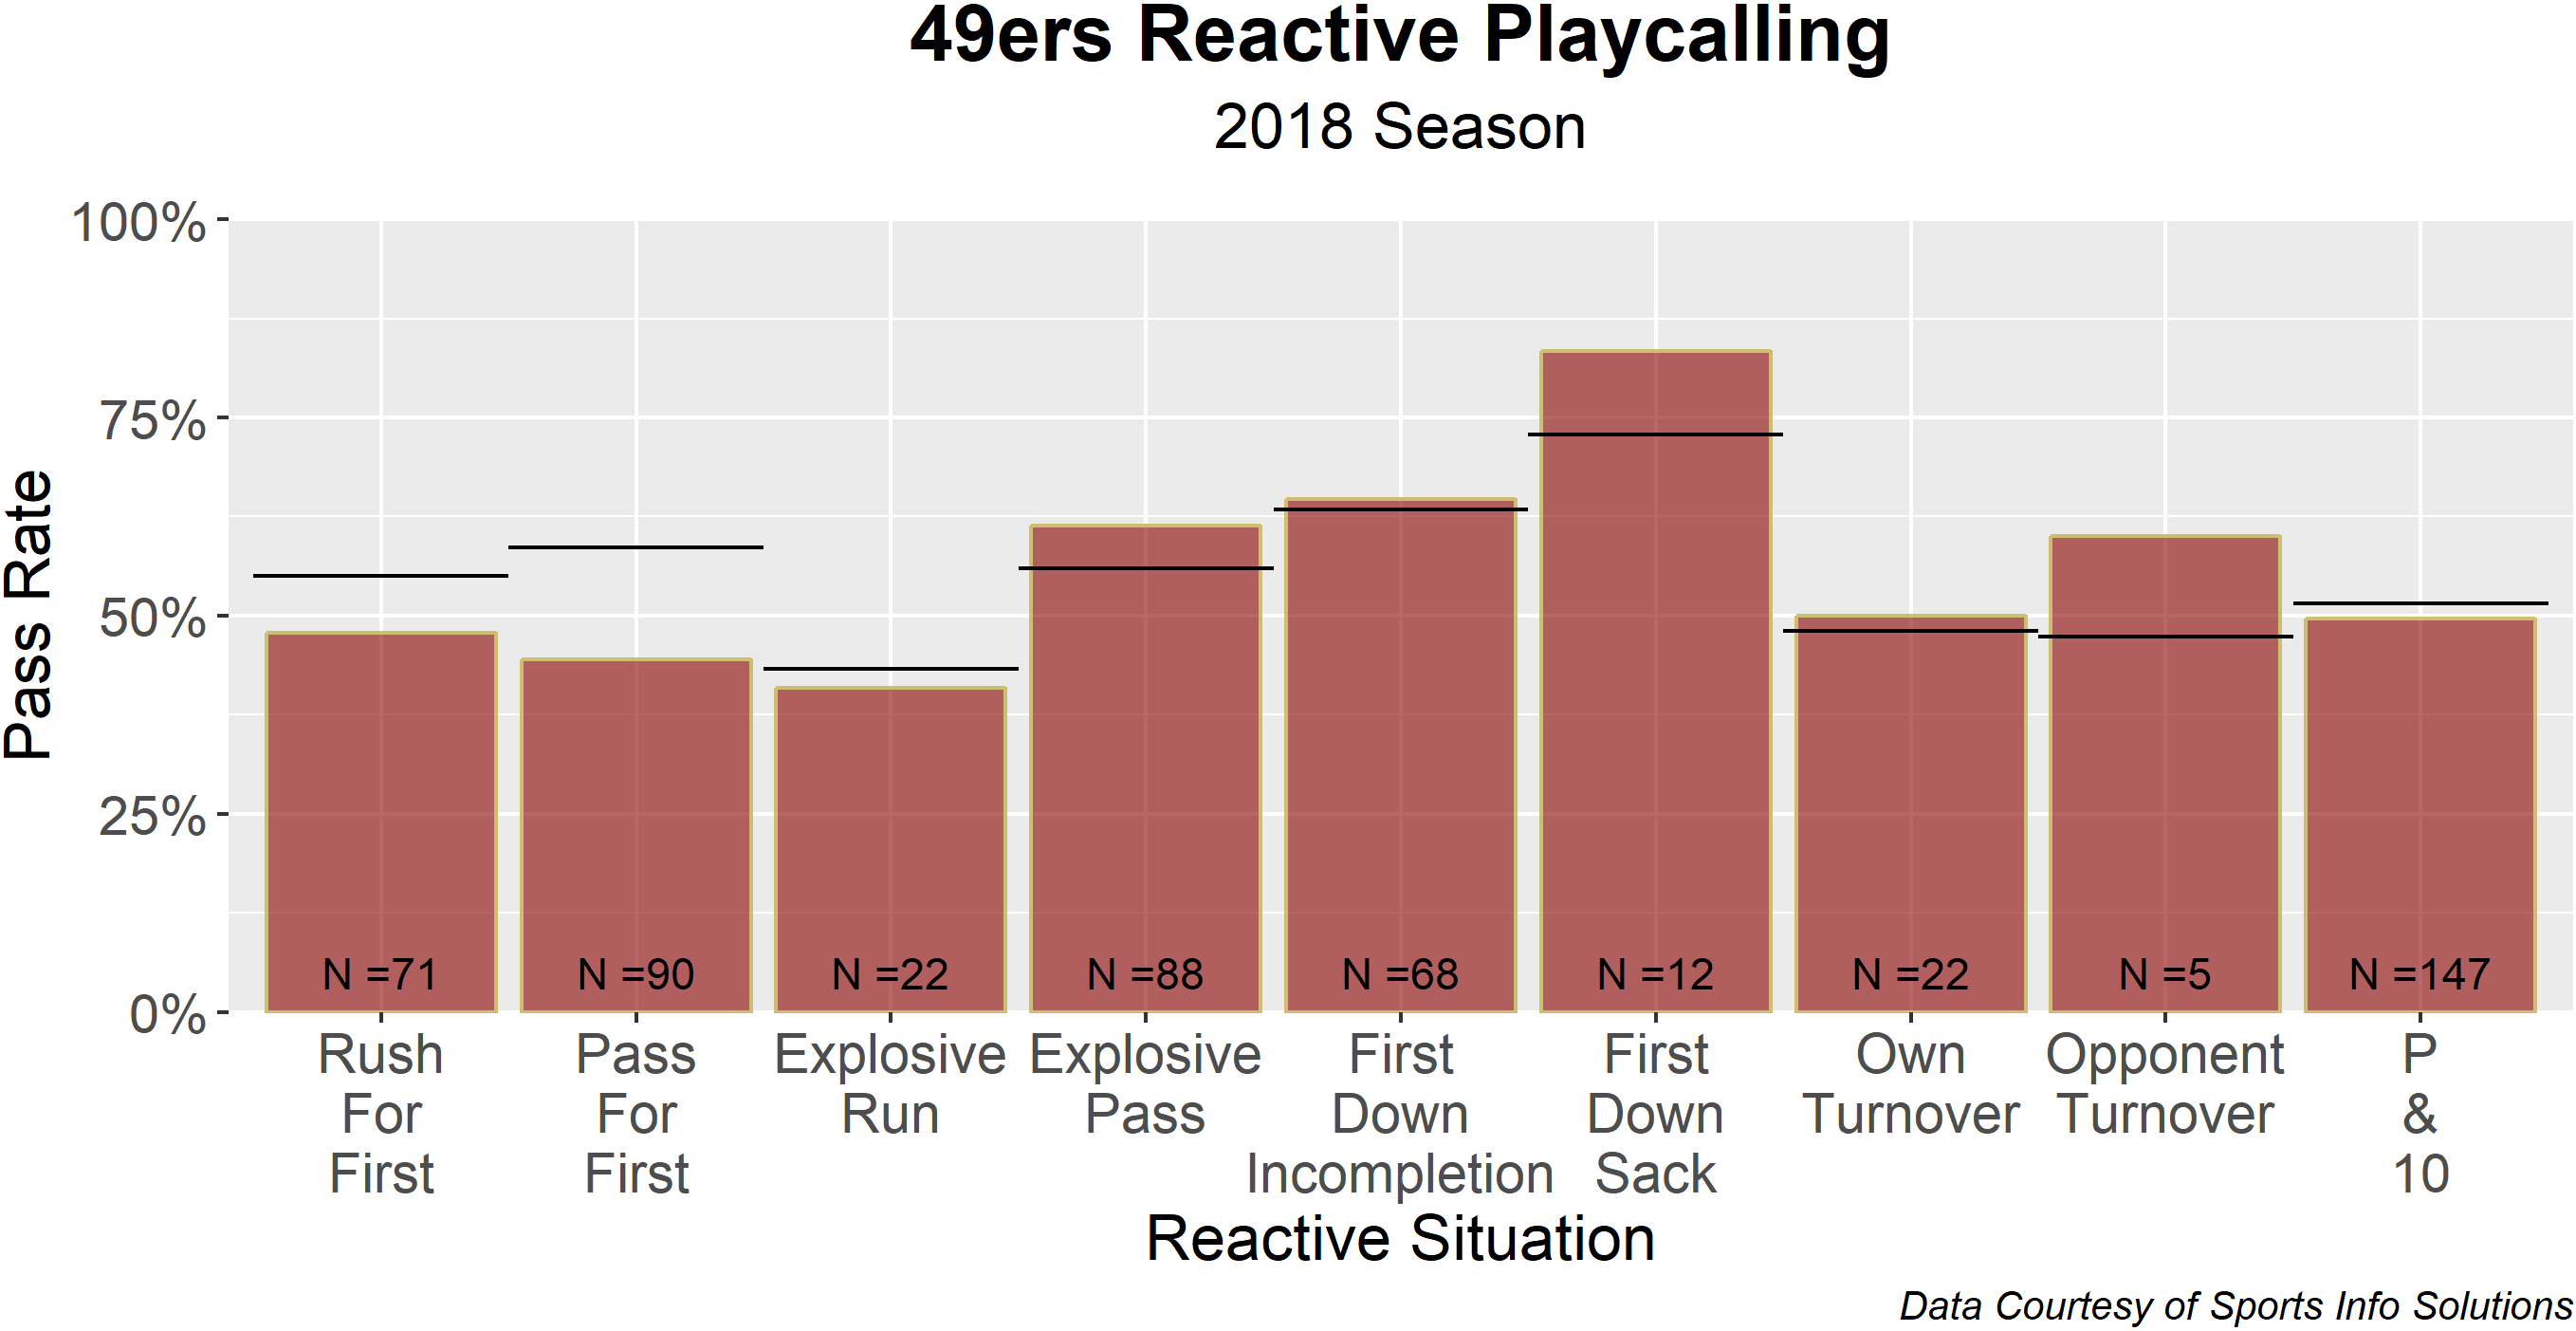
Reactive Playcalling in the NFL
By
How do playcallers behave differently following the particular outcome of a play? Every team is covered.
-
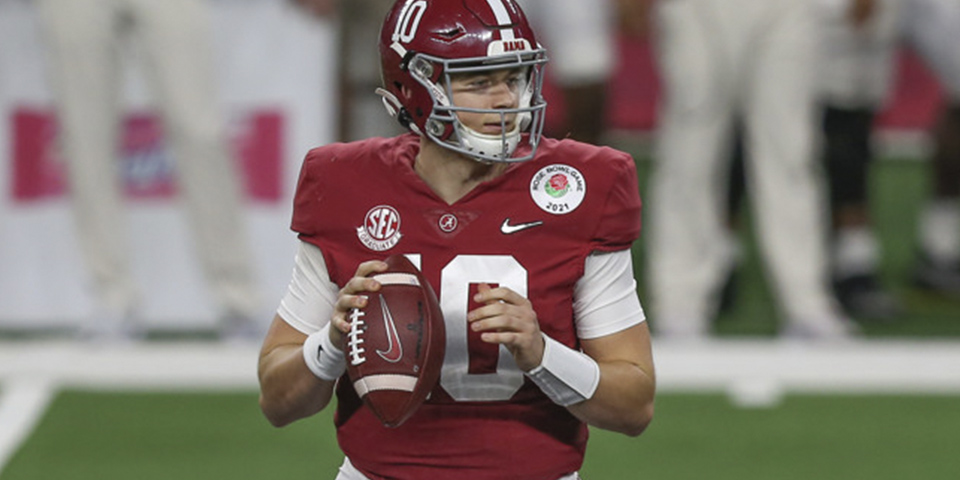
And Then There Were Three: a Statistical Comparison of Haskins, Lock, and Jones
By
The combine is a distant memory, pro days are all but over, and it seems all that’s left to do is twiddle our thumbs as teams make their final preparations for the NFL Draft. But, arguing amongst ourselves about quarterbacks is a rich tradition, so perhaps that is the best way to occupy our time…