Sports Info Solutions
Author: John Shirley
-
Will the Packers free agent spending be more impactful than a draft and develop strategy?
By
Green Bay has spent in an atypical manner. But there seems to be a method behind this decision.
-
Will Jason Witten’s Return Provide a Spark for the Cowboys?
By
By John Shirley Earlier today, Jason Witten decided to postpone his career in the broadcast booth and return to the football field. He is coming out of retirement for his 16th season with the Cowboys. But will his return be a success and help the Cowboys return to the playoffs and compete for a title?…
-
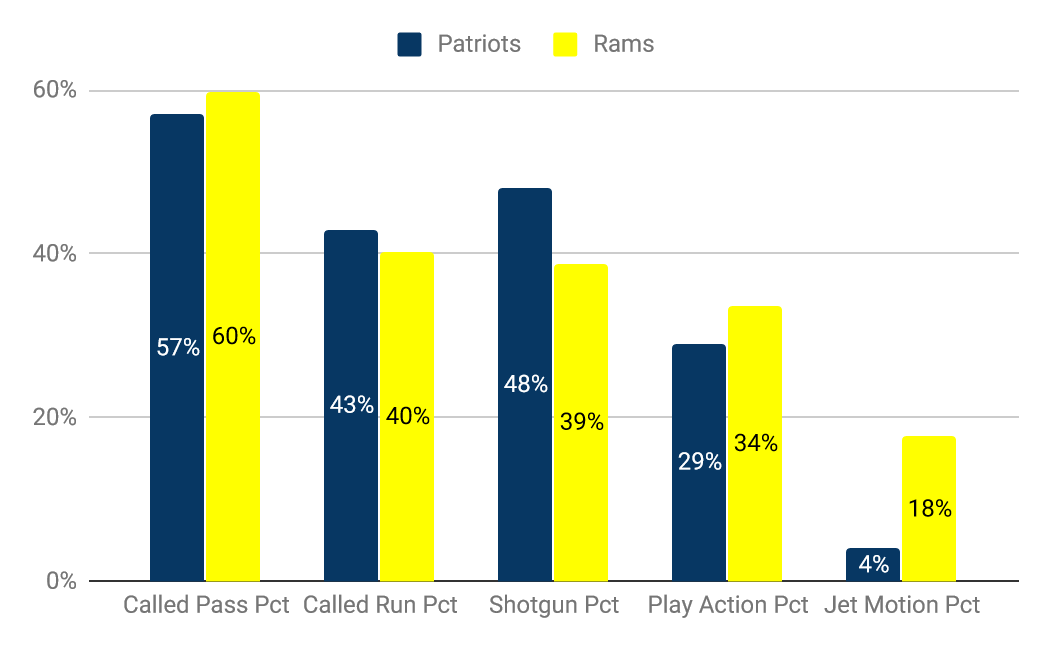
Super Bowl Preview: Patriots vs. Rams
By
By John Shirley Tale of the Tape It should be unsurprising that both the Rams and Patriots rank highly on offense. Both teams rank in the top ten in both EPA/Called Pass (includes scrambles and excludes spikes) and EPA/Called Run (excludes scrambles and kneel downs). The weakest unit based on average EPA is the Rams’…
-
Preview: NFC Championship – Rams vs. Saints
By
On the Rams play-action, the Saints use of Michael Thomas and other key stats to know.