Category: Baseball

  • 4 Players Hoping For a Better Fate This Month

    By Max Greenfield

    With four weeks to go, the playoff push is in full swing, with every at-bat potentially being a critical one.

    This is a time when some players who underachieved can make up for that with one good month. I wanted to try to find a few players along those lines who could play a big role in September if they got hot. Using our expected statistics (calculated off batted ball type, velocity, and location, which is slightly different from the inputs used by Statcast), here are four candidates.

    Jurickson Profar
    The Oakland Athletics’ young second baseman has been underachieving this year. Profar has a .214 batting average, 18 home runs and a below league average OPS of .704. Yet, based off our expected numbers, Profar should be hitting .272 with 20 home runs, and an .843 OPS.

    One reason Profar could be seeing such a stark difference is that his batting average on fly balls is 70 points below the MLB average. Another is that he’s hitting .163 when hitting a ground ball or short line drive against a shift (in fact, his unshifted numbers are of a similar nature).

    Profar could be on the right track. He’s hitting .333 in his last 10 games, with homers on the road against the Royals and Yankees and an extra-base hit in each of his last three home games.

    Dexter Fowler
    The St. Louis Cardinals outfielder has had a decent rebound season after a tough 2018. He’s had a 1.6 bWAR (baseball-reference WAR) which is over 3 wins higher than what he had in 2018.

    Fowler is currently hitting .249 with 16 home runs and a .780 OPS this year but based off our data, his expected numbers are a .292 batting average, with 20 home runs and a .903 OPS. To put that in perspective, he’d rank inside the top 30 with that OPS this year. If he could hit like that for a month, he’d be highly valuable to the Cardinals’ NL Central chances.

    He’s trending the right way. He had an .849 OPS in August.

    Lorenzo Cain
    Another team in the middle of the NL Central and Wild Card race is the Milwaukee Brewers. Cain was a big contributor to the Brewers last year, posting a 6.9 bWAR, the second highest mark of his career.

    But Cain has struggled in 2019 with a .251 batting average, eight home runs, and a .672 OPS. Though our expected numbers have him a little closer to league average offensively with .287 batting average, 10 home runs, and a .766 OPS. If Cain doesn’t hit a line drive, his offensive production is well under MLB average.

    In the past Cain was able to have well above league average production on ground balls, but that has not kept up this year His hard-hit rate is down too.

    Some of that may be explainable by injuries to his knee, thumb, and most recently his oblique. Cain’s defensive value is still very high, as he has 18 Defensive Runs Saved, most among centerfielders. Now, the Brewers are looking for his offense to match that

    Jesus Aguilar, Rays
    Aguilar struggled early in 2019 with the Brewers and the hope was that’d he’d find some success with the Tampa Bay Rays. While Aguilar’s numbers are better with Tampa, increase in batting average, and on base percentage, he’s still seeing below-average results in power.

    Aguilar’s expected batting average is only 18 points higher than his .238 clip. However, his expected OPS is .780, which is 70 points higher than his actual OPS of .710. Aguilar has 12 doubles and 10 home runs. Our expected numbers give him 15 and 12. The Rays could use a little extra carry on his fly balls this month to boost their postseason hopes.

  • Hey, Nicholas Castellanos: Don’t be such a grump about analytics!

    By Mark Simon

    Chicago Cubs right fielder Nicholas Castellanos recently expressed his distaste for analytics in an interview with Bob Nightengale of USA Today.

    In a way, that’s unfortunate. The analytics show that Castellanos has made considerable defensive progress this season, his second full season playing right field.

    In 2018, Castellanos had about as rough a season in right field as any player did anywhere. He cost the Tigers 19 runs, almost entirely based in his struggles hit to the deepest part of ballparks.

    But this season, he’s fared far better at turning those balls into outs, thus taking away potential doubles and triples. Here’s the comparison:

    Balls Hit to Deepest Part of Right Field
    Year Plays Made Opportunities Plays Below Average
    2018 81 134 17
    2019 83 118 1

    Castellanos has gone from performing terribly on those balls to becoming an average fielder on them. He’s got a ways to go to be Cody Bellinger (80 plays made on 95 opportunities) but he’s improved to a reasonable level of adequacy.

    The improvement could be rooted in any number of things, with positional familiarity being the most likely. He’s also played a little deeper than he did last season — moving from an average starting position of 289 feet to 292 feet at Comerica Park, and playing 294 feet deep at Wrigley Field. The one or two steps he may have gained in this could be difference makers.

    Granted, Castellanos still has a ways to go. He’s cost his teams a combined six runs this season and his arm could use improvement in terms of baserunning deterrence. But the analytics are showing something positive for him, and perhaps giving him a reason to give them a chance.

  • What makes Mike Soroka and Max Fried so good?

    What makes Mike Soroka and Max Fried so good?

    By Brandon Tew

    Baseball in 2019 looks drastically different than it did five years ago. Now, hitters worry about launch angles and exit velocities. But this year’s efforts of Atlanta’s dynamic duo of Max Fried and Mike Soroka should worry Braves’ opponents.

    Fried and Soroka lead the Braves rotation with 14 and 10 wins, respectively. They also sit among MLB’s best in a stat that tries to combine launch angles and exit velocities into a quantifiable stat for hard-hit balls. The pair of young arms rank second and third in lowest rate of barrels allowed among pitchers with at least 350 batted ball events this season, with Fried allowing them at a 2.6% rate (15 barrels allowed) and Soroka 3% (18).

    MLB.com notes that the “barrel” classification is assigned to batted-ball events whose comparable hit types (in terms of exit velocity and launch angle) have led to a minimum .500 batting average and 1.500 slugging percentage since Statcast was implemented Major League wide in 2015.

    To be Barreled, a batted ball requires an exit velocity of at least 98 mph. At that speed, balls struck with a launch angle between 26-30 degrees always garner Barreled classification. For every mph over 98, the range of launch angles expands.”

    This stat helps quantifies the number of hard-hit balls on the bat’s “sweet spot.”  With the optimal launch angle and exit velocity, the ball usually goes for a base hit.

    Fried and Soroka minimize this with by allowing low launch angles. They rank second and third in the MLB in average Launch Angle with Fried at 3.5 degrees and Soroka at 4.9 degrees.

    So how has this Atlanta Braves pair missed so many barrels? They accomplish this in slightly different ways.

    How they do it

    Fried, a smooth throwing lefty, uses his four-seam fastball and a wicked curveball to keep hitters off-balance. With a lot of late-life on his fastball, Fried creates weak contact even in favorable counts to the batter.

    Soroka, a right-hander uses pinpoint command and a heavy sinker to induce weak contact. Soroka will throw his sinker at any time and keep hitters off of it with a slider away or four-seam fastball that comes up and in.

    Their different approaches embody the shift in pitching over the past five years, with Fried putting emphasis on a high-velocity four-seamer and good breaking pitch while Soroka favors the old-school pitching combo of a sinker and slider. Soroka pitches to contact and keeps the ball down in the zone.

    When you’re as adept at missing barrels as Fried and Soroka, you try to get ahead in the count and strike out batters or create soft contact, such as a weak ground ball. Both are great at producing ground balls. Soroka and Fried each have 53% ground ball rates, with Soroka ranking fourth and Fried sixth among ERA-title qualifiers.

    As for any pitcher, it is always best when you’re pitching ahead in the count to keep batters on the defensive so they can’t sit on one specific pitch, in one particular zone. First pitch strikes are a vital part of getting ahead in the count. They each are above MLB average of 61%, with Soroka at 64.6% and Fried at 63.7%

    Soroka pounds the arm-side bottom right corner of the zone with his sinker. He does this all game long. When behind in the count hitters have no choice but to either swing and probably make terrible contact or take the pitch for a strike. Hitters constantly smash his sinker into the ground. It’s a pitch that either runs under the hands of a right-handed batter or down and away from a lefty. Soroka also has the command to work this part of the strike zone.

    When he’s not throwing his sinker, he’s working the other side of the plate with his slider, throwing it down underneath the zone, making it almost impossible to square the ball up on this particular pitch.
    Soroka Slider
    Hitters are once again faced with the decision to swing and likely make a soft-contact grounder, or go fishing for a ball destined for the dirt. They’re hitting .136 when an at-bat against Soroka ends with this pitch. That ranks fifth-lowest in MLB among starting pitchers, behind Dinelson Lamet (.095), Justin Verlander (.112), Sonny Gray (.119), and Mike Cleveinger (.119).

    The heat map below shows how Fried utilizes his curveball to keep hitters guessing, while still throwing it in the zone often and inducing weak contact or missed swings. If hitters do connect, they generally swing over the top sending the ball darting towards the ground.
    Fried Curveball
    This also enables him to use his fastball more effectively. A fastball with so much late life  keeps hitters from making great contact with the heater. When  ahead in the count Fried can still be sporadic with his fastball command but he still stays inside the zone.

    What lends to Fried’s remarkable knack for missing the sweet spot of bats or getting a swing and a miss is the tunneling of both of these pitches and how they look so similar to the hitter and have late action to them. Fried can occasionally lose his release point and miss arm side and high with his fastball or hang his curve but when he’s on, he’s excellent at throwing both of these pitches from the same release point. making it hard to pick up which pitch is coming towards the batter.

    Why doesn’t Fried have as good of an ERA as Soroka? When hitters do get the ball in the air, they hit it out of the park. Fried’s home run to fly ball rate is 19%. Soroka’s is 8%. That may not entirely be Fried’s fault. Based on our expected stats (determined by the batted ball type, where the ball was hit, and how hard it is hit), Fried has allowed three more home runs than expected. Soroka has allowed three fewer.

    This one-two punch will be key for Atlanta down the stretch in the NL East. For them to continue racking up wins, Fried and Soroka will have to keep missing Barrels.

  • Stat of the Week: Bellinger, Trout battle for Total Runs lead

    By Mark Simon

    Which player has had the best season in baseball this year?

    That’s a very tough question to answer right now. Cody Bellinger of the Dodgers and Mike Trout of the Angels are basically neck-and-neck in Sports Info Solutions’ measuring stick, the Total Runs leaderboard.

    Total Runs is the sum of a player’s Runs Created (using Bill James’ formula), Defensive Runs Saved, and Baserunning Runs, along with a positional adjustment. The positional adjustment rewards a player for his playing time at a tougher position (for example, it’s harder to be an average shortstop than an average first baseman). For pitchers, Pitching Runs Created are included to account for how much a pitcher has limited opponent scoring.

    Trout has 122 Runs Created, one run better than Christian Yelich and six better than Bellinger. Trout’s edge over Bellinger stems from his big advantage in reaching base (.436 on-base percentage to .409). He also has a six-point edge in slugging percentage (.651 to .645).

    Trout is also eight Baserunning Runs better than Bellinger. He’s credited with six to Bellinger’s negative-two. Trout ranks first in Bill James’ Baserunning Gain stat (+25), which measures how often a runner takes an extra base on hits, wild pitches, and the like, while avoiding outs on the bases.

    Bellinger is hurt by below-average stolen base efficiency. He’s stolen 11-of-16 after stealing 14-of-15 a year ago. He’s also dinged for going second-to-home on a single only six times in 17 opportunities (a 35% rate — the MLB average is about 60%). Trout has scored 12 times from second on 16 singles (75%).

    Summing batting and baserunning gives Trout 128 runs and Bellinger 114 runs.

    Where Bellinger makes up the ground is on defense. His 23 Defensive Runs Saved are tied for most in the majors. Bellinger has taken to right field well in his first full-time season there. He has an MLB-best 19 Runs Saved there, with a combination of outstanding catches and assists (this one and this one are among the best). He also has three Runs Saved in 26 games at first base.

    Trout has saved two runs with his defense, down from eight in 2018. He’s been hindered by 15 Defensive Misplays & Errors as charted by our video scouts. That’s up from seven in 2018.

    Now Bellinger has the advantage, 137 to 130, with only the positional adjustment left to be made.

    Trout narrows the gap there. His adjustment is worth 20 runs. Bellinger’s is worth 15 runs.

    That gives Bellinger 152 Total Runs and Trout 150 Total Runs. Wow, it’s close.

    Here’s the current leaderboard. If you want to keep up to date with this race, follow along at Bill James Online by clicking here.

    Total Runs Leaderboard
    Player Team Total Runs
    Cody Bellinger Dodgers 152
    Mike Trout Angels 150
    Trevor Story Rockies 143
    Ketel Marte Diamondbacks 143
    Ronald Acuna Jr. Braves 138
    Christian Yelich Brewers 136
    Justin Verlander Astros 129
    Marcus Semien Athletics 129
    Mookie Betts Red Sox 129
    Alex Bregman Astros 129
  • How does Victor Robles have 15 Defensive Runs Saved?

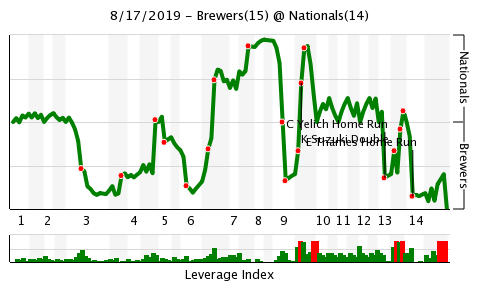
    By MARK SIMON

    Milwaukee Brewers center fielder Lorenzo Cain leads all players at the position with 18 Defensive Runs Saved.

    But the player who ranks second might surprise you. It’s not Kevin Kiermaier or Byron Buxton. It’s Victor Robles of the Washington Nationals.

    What has made Robles a standout is not just how he fares at catching balls (though as we’ll note in a moment, he’s pretty good there), but the value of his arm as a baserunning deterrent. He leads all players with seven Outfield Arm Runs Saved.

    How does a player accumulate that many Runs Saved?

    Robles has allowed 48% of baserunners to advance on balls he’s fielded in center, a rate that is slightly better than the MLB average of 53%. The key is that Robles has erased 11 baserunners attempting to advance with throws that did not require a cutoff man. Only two other center fielders even have half that many (Ramon Laureano and Jackie Bradley Jr. have seven).

    Of the 11 baserunners, six were thrown out at second base, three at home plate (literally saving a run), and two at third base. Robles’ total was boosted by four assists in a six-day span in the middle of this month (including this one and this one). The values of those 11 plays make up most of those seven runs.

    Robles is adept in the field too, though not at the level of contemporaries like Cain, Kiermaier or Buxton. Robles’ six Range & Positioning Runs Saved isn’t bad though. It ranks tied for seventh among center fielders.

    Robles’ inventory of great plays in the field includes a wall-crasher to rob Addison Russell of an extra-base hit to preserve a one-run lead in the ninth inning against the Cubs on May 19. That ball had a 4% out probability based on how far and how hard it was hit. But most of Robles’ best work has come on shallow fly balls.

    Robles has played a modest center field at Nationals Park, relative to others who have played there this season. His average depth there is 313 feet (which is coincidentally the same as Cain), which is about two feet shallower than the average center fielder this season. The highlight-worthy catches come on the deep balls. The catches on shallow balls look routine for him but might not be for someone playing deeper.

    As such, Robles’ Range & Positioning rating on balls hit to the shallowest part of the outfield is better than his range rating on balls hit to the deepest part. He’s eight plays made above average on the former, tied with Bader for second in MLB.

    Jake Marisnick leads at nine plays above average on shallow balls. Not everyone can survive a below-average rating on deep balls, but Robles can because he makes so many plays on everything else and has the capability to throw out so many baserunners.

    Victor Robles – Plays Made Above Average (By Depth)
    Plays Made Opportunities Plays Above Average
    Shallow 63 95 8
    Medium 104 115 3
    Deep 84 117 -2
    * Opportunities = Balls on which the CF had a >0% chance of making the play
    * Read this as “Robles made 63 plays on 95 shallow opportunities. The average CF would have made 55 on those same opportunities.”

    Robles hasn’t hit like Juan Soto or Anthony Rendon, but the glove is keeping him on the field, and makes him a highly-valuable part of the Nationals’ playoff push. And a recognizable name among the top defensive center fielders in the game.

    To learn more about our defensive metrics, try the SIS Baseball Podcast. Click here for the link.

  • What if Players’ Weekend nicknames were about their stats?

    By MARK SIMON

    One of the fun things about Players’ Weekend is looking at the names on the back of the jerseys and learning the stories behind the choices. Players are allowed to customize those to whatever nickname or meaningful combination of words they want.

    For example: Oakland Athletics pitcher Mike Fiers is “Smokey.” Indians pitcher Shane Bieber is “Not Justin.” Rangers outfielder Hunter Pence is the shrug emoji, ¯_(ツ)_/¯, and injured Yankees outfielder Giancarlo Stanton is “Parmigiancarlo.”

    That got us to thinking: what if players picked their weekend nicknames based on their stats?

    What would be on the backs of those jerseys?

    Here are a few thoughts.

    Chicago Cubs, Javier Baez – “El Mago”

    Ok, so we’re totally cheating to start this off. But with Baez, that choice is way too obvious and gives us an excuse to share his stats.

    Baez ranks third among shortstops with 14 Defensive Runs Saved. He’s the best shortstop at converting double plays. And you’ve seen his great tags on the biggest stage (his quick hands are like a magician’s). Oh, and he also leads the majors in something we track called “Good Baserunning Plays,” which is basically what you think it would be. He has 10 in 2019.

    Kansas City Royals, Whit Merrifield – “Mr. Line Drive”

    It’s been a rough season for the Royals, but they do have someone near the top of the leaderboard in one stat. Utility man Merrifield earns his moniker, because his 29% line drive rate ranks first among batting title-qualifiers.

    Milwaukee Brewers, Lorenzo Cain – “$teal HR”

    We’re using the $ sign as Cain does for his weekend nickname, which is “3 Kid$.”

    Cain has been the best in the majors at robbing home runs both this season (4) and over the last three seasons (7). Honorable mentions to Josh Reddick and Adam Engel, who each have five.

    New York Mets, Jeff McNeil – “Don’t Shift Me!”

    McNeil has benefited as much from defensive shifts of any hitter, doing so by hitting the ball away from the defense. He’s batting an MLB-best .400 (26-for-65) when hitting a grounder or short liner versus a shift.

    New York Yankees, CC Sabathia – “The Bat Breaker”

    There are many ways we could have gone with the Yankees, but since it’s his final season and we want to show off the suite of stats we track, we go with Sabathia’s tendency to do damage to opposing lumber with his pitches.

    Sabathia has broken 53 bats by Sports Info Solutions’ count over the last four seasons. That’s easily the most in the majors.

    New York Yankees, Aaron Judge – “96.6”

    A shout-out to our friends at Statcast. Judge’s average exit velocity of 96.6 MPH leads the majors by 2 MPH over Nelson Cruz (94.5). That number is not far removed from his uniform number, 99.

    Oakland Athletics, Matt Chapman – “Down the Line”

    Chapman is arguably the game’s top defensive player. And what makes him great is in how he takes away would-be doubles down the third base line better than anyone else in the game.

    Chapman has 64 Defensive Runs Saved over the last three seasons, easily the most of any third baseman. He has more than twice as many as second-place Nolan Arenado (31). We thought about making his nickname “Brooks” after baseball legend Brooks Robinson, but he’s not quite ready for that just yet.

    Philadelphia Phillies, J.T. Realmuto – “Don’t Run on Me”

    Realmuto has eight Defensive Runs Saved for stolen base deterrence, easily the most in the majors. He’s thrown out 29-of-69 (42%), the best rate of his career and the best rate in MLB.

    Pittsburgh Pirates, Bryan Reynolds – “Keeler”

    This one is a nod to baseball history. It was Hall-of-Famer Wee Willie Keeler who coined the term “hit ’em where they ain’t.” No one has done that better than Reynolds, who leads the majors with a .398 BABIP this season.

    St. Louis Cardinals, Dakota Hudson – “You’re Grounded”

    This has nothing to do with parental punishment and everything to do with keeping baseballs from going airborne. Hudson leads the majors with a 58% ground ball rate.

    This also could have gone to Tampa Bay Rays pitcher Ryan Yarbrough, who has gotten outs on an MLB-best 82.5% of the ground balls and bunts hit against him.

    San Diego Padres, Austin Hedges – “The Framer”

    Hedges has had a phenomenal defensive season for the Padres. He leads all catchers in our Strike Zone Runs Saved stat, representative of the best catcher at getting his pitchers more strikes than expected this season.

    San Francisco Giants, Kevin Pillar – “Superman”

    Pillar is already known by this moniker to fans, especially those in Toronto. Over the last five seasons, he has the most diving, sliding and jumping catches in the majors (112). You can listen to him talk about this on a past edition of the Sports Info Solutions podcast.

    Tampa Bay Rays, Charlie Morton – “Captain Hook”

    Charlie Morton’s curveball has been one of the most valuable pitches in baseball this season, per FanGraphs’ run values.

    His former Astros teammate Collin McHugh will be wearing what Morton’s nickname could have been, “12 to 6.”

    Washington Nationals, Max Scherzer – “FIP to Be King”

    The Nationals ace, just back from injury, has used Players’ Weekend as a means of pointing out that he was one blue eye and one brown eye. We’ve changed his name to reflect his outstanding numbers with regards to strikeouts, walks and home runs allowed. He has the lowest FIP in the majors by more than half-a-run (2.18).

    For more notable stats from Sports Info Solutions, try our Stat of the Week.

  • Stat of the Week: World’s No. 1 Starting Pitcher

    By Mark Simon

    Max Scherzer is returning to the Washington Nationals
    rotation on Thursday after missing nearly a month with a rhomboid muscle
    strain. This is just in time both for the Nationals’ playoff push and for
    Scherzer to try to regain his status as the top pitcher in Bill James’ World’s No. 1 Starting Pitcher Rankings.

    Scherzer, who had a 1.17 ERA in 10 starts prior to his injury, was the No. 1 starter in the rankings to begin the year. He had a small lead entering Wednesday, but Justin Verlander passed him with a great start in a loss to the Tigers.

    Here is the current top 10.

    Bill James World’s No. 1 Starting Pitcher Rankings
    Rank Name Team Current Score
    1 Justin Verlander Astros 550.3
    2 Max Scherzer Nationals 547.4
    3 Jacob deGrom Mets 522.6
    4 Gerrit Cole Astros 516.9
    5 Chris Sale Red Sox 504.3
    6 Clayton Kershaw Dodgers 497.0
    7 Zack Greinke Astros 490.9
    8 Aaron Nola Phillies 487.5
    9 Stephen Strasburg Nationals 486.1
    10 Patrick Corbin Nationals 486.0

    The rankings use a system devised by Bill James in which the primary
    component is a pitcher’s Game Score in each game he starts. Daily updates to the rankings and a comprehensive explanation of the methodology can be found
    here.

    Verlander has survived 33 home runs against him to post a 2.77 ERA. He has 14 starts with a Game Score of 70 or higher. No one else has more than 10. He’s one of three Astros pitchers in the top 10. The Nationals also have three pitchers in the top 10.

    Several pitchers have made big jumps to get into the top
    20 (first number indicates ranking entering March 20):

    Charlie Morton (from 34 to 12)
    Lance Lynn (66 to 13)
    Hyun-Jin Ryu (79 to 17)
    Sonny Gray (65 to 16)
    Luis Castillo (52 to 18)
    Walker Buehler (49 to 15)

    Charlie Morton’s ascent has come with a new team, as he signed with the Tampa Bay Rays this offseason. He’s used a dominant curveball to lead the AL with a 2.70 FIP and ranks second in the league with a 2.85 ERA.

    Lance Lynn is also a free agent signing that paid off for the Rangers. He has a 2.84 ERA in his last 18 starts. Hyun-Jin Ryu has a major-league-leading 1.64 ERA. He’s the healthiest he’s been in a long time, has shown a dominant chanegeup, and will likely make his most starts in a season since he had 30 in 2013.

    Sonny Gray had a rough time with the Yankees, but a trade to the Reds has done him good. His ERA is down nearly two full runs from 2018 to 2.92. His teammate, Luis Castillo, has also had a big drop in ERA thanks to one of the best changeups in baseball. Walker Buehler’s ERA is up from 2018, but he’s had two great starts to boost his score, a 16-strikeout complete game against the Rockies and a 15-strikeout complete game against the Padres.

    The pitcher who has slipped the furthest out of the top 10 is Corey Kluber, who dropped from No. 5 to 30 after missing most of the season with a fractured forearm. He was getting close to returning from injury, but had a recent setback. Kluber and Chris Sale (currently No. 5) may continue to drop due to their injury-related inactivity.

    For more baseball content, check out the Sports Info Solutions Blog or the SIS Baseball Podcast.


  • New baseball podcast: Talking with a top prospect

    On this episode, Sports Info Solutions senior research analyst Mark Simon (@MarkASimonSays) details the story of the success of Yankees outfielder Mike Tauchman, who has had an unexpectedly impressive season in the field (0:59). Mark is also joined by minor league third baseman Ke’Bryan Hayes (@KeBryanHayes), who is ranked among the top infield prospects in the minor leagues. Ke’Bryan explains where he learned to play defense (3:15), the challenge of not taking a hitting slump into the field (8:03), how minor league teams provide scouting information on where players should position themselves (9:19) and the famous catches made by his father, former major league third baseman Charlie Hayes (12:24). Eric Longenhagen (@longenhagen) of FanGraphs.com adds a brief scouting report on Hayes (15:29).

    Mark then welcomes senior research analyst Alex Vigderman (@VigManOnCampus) and Andrew Kyne (@Andrew_Kyne), who share what they learned from the Saberseminar Conference in Boston. They share information about a biomechanic study at Wake Forest university (17:54), women working in MLB front offices (19:40), how the Red Sox hitting coaches work with their hitters (20:30), re-imagining the strike zone (22:02), C-Flap helmets (23:29), and the importance of outfielder jumps (24:16).

    The three then answer listener mail on umpires (25:44), stats to measure pitch effectiveness (27:41), and the best stats for predicting “Beat the Streak” success (30:34) and try to stump listeners with Ridiculous Numbers of the Day trivia (32:44).

  • How does Mike Tauchman have 14 Defensive Runs Saved?

    By Mark Simon

    The New York Yankees outfield has been overwhelmed by injuries this season. At various times, Aaron Judge, Aaron Hicks, and Giancarlo Stanton have been sidelined. In looking for someone who could fill in at all three spots off the bench, they turned to 28-year-old Mike Tauchman as a replacement.

    Tauchman has been great, both at the plate and in the field, and it’s the latter that we’ll focus on here.

    Tauchman has saved 14 runs with his defense, which ranks tied for sixth among outfielders this season. Of the outfielders ranked in the top 17, Tauchman has the third-fewest innings played. He’s made the most of his time in the field.

    How has Tauchman reached such lofty numbers, normally reserved in the Yankees outfield for Brett Gardner?

    He has nine Runs Saved in left, one in center and four in right.

    Let’s focus specifically on left field and right field.

    Sports Info Solutions divides each outfield into three sections – shallow, medium, and deep. Tauchman gets a statistical credit or debit on any ball hit to those spots in which he has a greater than zero percent chance at making the catch. The credit or debit is based on the historical probability of each batted ball being caught.

    If Tauchman makes a catch on a ball that is typically caught by a left fielder 40 percent of the time, he gets a credit of 0.6 (1 minus 0.4). If he misses it, he gets a debit of 0.4 (for the 40 percent of the time the ball is caught). Credits and debits are added up to get a player’s Range and Positioning rating, which is converted into Runs Saved.

    Here’s how Tauchman has done on shallow, medium, and deep balls in the two corner outfield spots.

    You can read this as (for example): “Mike Tauchman has 29 outs on 44 plays in which he had a greater than zero percent chance to make the play. The average player would have recorded 24 outs (29 minus 5).”

    Mike Tauchman – 2019 Season (LF & RF)
    Outs Plays with >0%

    out probability

    Plays Made

    Above Average

    Shallow Balls 29 44 5
    Medium Balls 41 50 3
    Deep Balls 36 45 3

    Of note, Tauchman has 15 catches on balls with an out probability of 50 percent or less and has failed to make the play in only five instances with an out probability of less than 50 percent. That number of high-value catches and the lack of high-value misses leads to a combined run value of nine runs at the corner outfield spots.

    Now why is Tauchman making those catches? Surveying the video of those plays found two common themes. One was that he was well positioned, likely by a combination of the Yankees coaches and the analytics department. Tauchman’s most valuable play is this catch on a ball hit by Tommy La Stella of the Angels. It doesn’t look like a difficult catch, but given where the ball was hit (the right-center gap) and how long it was in the air for, that’s a ball that is caught by the right fielder only six percent of the time.

    That play does show something else that holds up. Tauchman is good at reading the low line drive and closing ground on it quickly. This catch against Cavan Biggio of the Blue Jays came on a ball that is turned into an out 13% of the time. He has another catch of that ilk on a ball hit by Yonder Alonso of the White Sox. That ball had an out probability of 26%.

    SIS Video Scouts chart Good Fielding Plays and Defensive Misplays & Errors, and players have a chance to gain or lose Defensive Runs Saved based on how they fare in each of those areas. Tauchman has 9 Good Fielding Plays and only 4 Misplays & Errors. Converting each of those plays to a run value gives Tauchman a net of three more Runs Saved. He receives his biggest spike (1.2 Runs Saved) for having a home run robbery against Pedro Severino of the Orioles.

    Lastly, let’s look at the deterrent value of his arm.

    Tauchman doesn’t have a large sample of plays involving baserunner advancement in center or right field. But in left field, he’s recorded three assists without a cutoff man and allowed 17 out of 38 baserunners to advance on base hits on balls he’s fielded. The 45 percent advancement rate is around MLB average.

    The bigger deal is those three instances in which he erased a baserunner (the value in doing so is significant). For that, he receives two runs of credit. The best of the plays he’s made with his arm might be this one nailing Garrett Hampson of the Rockies at home plate.

    Putting it all together, Tauchman gets:

    • +10 Runs Saved for his Range & Positioning (9 for the corners, 1 for centerfield),
    • +3 Runs Saved for his Good Fielding Plays
    • and +1 Run Saved for the deterrent value of his arm.

    That combination makes him one of the most valuable defensive outfielders and one of the best stories in MLB (for more on Tauchman check out either of those links).

    Most Defensive Runs Saved – Yankees
    Mike Tauchman 14
    Aaron Judge 11
    Brett Gardner 8

    For more stories like this that go inside the numbers, check out our Stat of the Week and the SIS Baseball Podcast.

  • What Happened to JaCoby Jones’ Defense?

    By Lindsay Zeck

    In 2018, JaCoby Jones led all outfielders in Defensive Runs Saved with 21. He was featured in a blog last October as a multi-position standout with his 11 runs saved in 452 innings in left field and 10 in 558 innings in center field. This season, however, he cost the Tigers 13 runs before suffering a season-ending injury to his wrist. The only outfielders who have cost their teams more are Ian Desmond (-20), Domingo Santana (-16), Shin-Soo Choo (-15), and Melky Cabrera (-13).

    So, what was the cause of Jones’ terrible numbers?

    Sure, he has played the entire season in center field, whereas last season he split his time between both left and center. However, as evidenced above by his 10 runs saved in center field , it wasn’t just his play in left field bolstering his numbers last season.

    The biggest decline in his defense came from his range and positioning, particularly on shallow and medium hit balls, costing nine runs this season and saving seven last season.

    In 2019, he cost nine bases on balls hit to shallow outfield and six bases on balls hit to a medium depth of the outfield, as opposed to costing one and saving two in center field, respectively, in 2018.

    Per Baseball Savant, Jones was playing deeper this season — starting an average of eight feet deeper in center field at Comerica Park this season than he did last season. He was playing an average of 335 feet from home plate as opposed to 327 in 2018. That eight feet clearly made it more difficult for him to make plays on shallower balls.

    It didn’t, however, help him to make plays on balls hit to deep center field. He saved six bases last season on those balls and only three bases this season, despite playing nearly 168 more innings in center field in 2019.

    This chart illustrates the difference in Jones’ performance in center field the last two seasons.

    JaCoby Jones
    Plays Made Opportunities Out Rate
    2018 Shallow 44 66 67%
    2019 Shallow 34 74 46%
    2018 Deep 62 74 84%
    2019 Deep 75 101 74%
    >> Opportunities: Balls on which he had >0% chance to get an out

    His arm is also partly to blame. While baserunners were running on him with about the same frequency as last season (61 percent of the time), he threw out one baserunner without the help of the cutoff man, as opposed to five baserunners last season.

    Jones also had 11 Defensive Misplays, the highest number of his career with nearly two months left in the season. His most common issues, with three misplays of each type, are failing to anticipate the wall and failing at his attempts of diving for a fly ball or line drive.

    The Tigers are hoping that when he does return from injury, he comes back as his 2018 defensive self. He is the biggest reason why the Tigers outfield is the worst in the American League and the second worst in all of baseball in Defensive Runs Saved with -34. Only the Rockies outfield is worse with -47. You can read about the Rockies’ woes here.

    It is worth noting that while Jones’ defensive performance decline, his offensive numbers got better.

    Jones greatly improved his slash line against fastballs, hitting .302 with a .470 slugging percentage and .847 OPS in 2019. This is a vast improvement over his .187 batting average and .623 OPS slash line against fastballs in 2018. This is due in part to his improved contact, swinging and missing only 18 percent of the time against fastballs this season as opposed to 25 percent last season.

    You could say that though he didn’t get to more balls in the field, at least he got to more of them at the plate.