Sports Info Solutions
Tag: Joey Gallo
-
Yes Baseball Fans, Joey Gallo Has A League-Leading Defensive Runs Saved Total
By
Don’t lose your minds over this, we can explain it.
-

Reviewing Candidates For The New-Look Shift
By
Nine players who could get the Joey Gallo treatment (including Gallo himself). But should they?
-

Stat of the Week: Who could be 2022’s Defensive Runs Saved Leader
By
Ryan McMahon is trying to do what no one else has done.
-
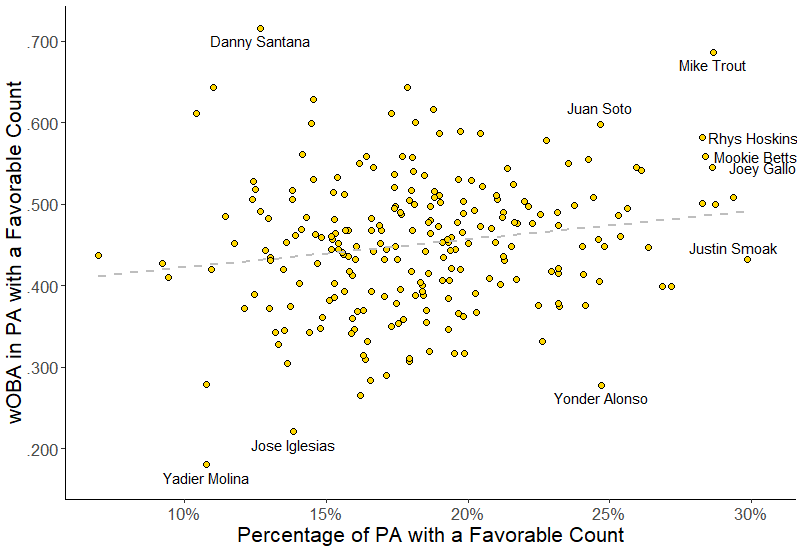
Which hitters reach favorable counts?
By
Which hitters get into favorable counts, like 2-0, 3-0, and 3-1? And which hitters then do damage?