Sports Info Solutions
Tag: Mike Trout
-
2026 Season Preview: Are the Angels A Good Defensive Team?
By
Zach Neto is the biggest bright spot on a team without many on the defensive side.
-

Stat of the Week: Active Players & The Baseball Hall of Fame
By
José Ramírez’s Hall of Fame stock is up at the moment. And Andrew McCutchen may be a more viable candidate than you think. We assess the leading active players in our Stat of the Week.
-

Stat of the Week: Aaron Judge, Blake Perkins, and Home Run Robberies
By
Two of the best homer robbers in MLB made great catches early this week.
-
Stat of the Week: Updates on HR Robs, Pitcher Injuries, Arenado & More
By
Updating some of the things we wrote about earlier this season
-
Bill James Handbook 2023 Excerpt: A Sizable Portion
By
We want you to buy the book! Here are nine snippets from essays by Bill James and our R&D staff.
-

Stat of the Week: The Angels Are Looking Good
By
A good approach at the plate and good results in the field have been vital to a 13-7 startt.
-

Why Move Mike Trout Off CF? Let’s Look at the Numbers
By
Trout doesn’t rate well in a couple of important areas.
-
Who has the best chance to reach MLB milestones? (Bill James Handbook excerpt)
By
Who has the best chance of hitting 500 or 600 home runs? What about the most likely pitcher to throw a no-hitter?
-
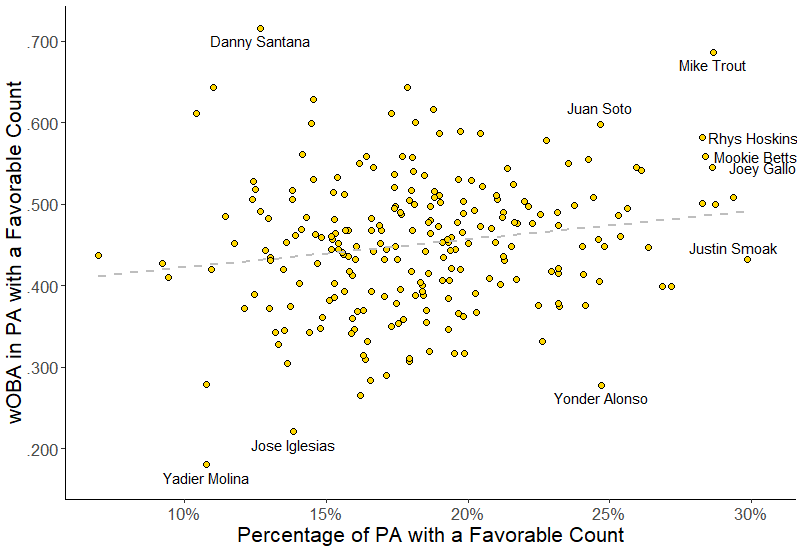
Which hitters reach favorable counts?
By
Which hitters get into favorable counts, like 2-0, 3-0, and 3-1? And which hitters then do damage?
-

Who are the best outfielders at avoiding mistakes?
By
Continuing our look at the most mistake-free players in baseball, we focus on the likes of Alex Gordon and A.J. Pollock.