Sports Info Solutions
Tag: New York Yankees
-
How does Mike Tauchman have 14 Defensive Runs Saved?
By
What are the different components that make Tauchman such a good outfielder?
-
Inside the numbers on Urshela’s improvements
By
Urshela has had the magic touch when it comes to hitting the ball hard.
-
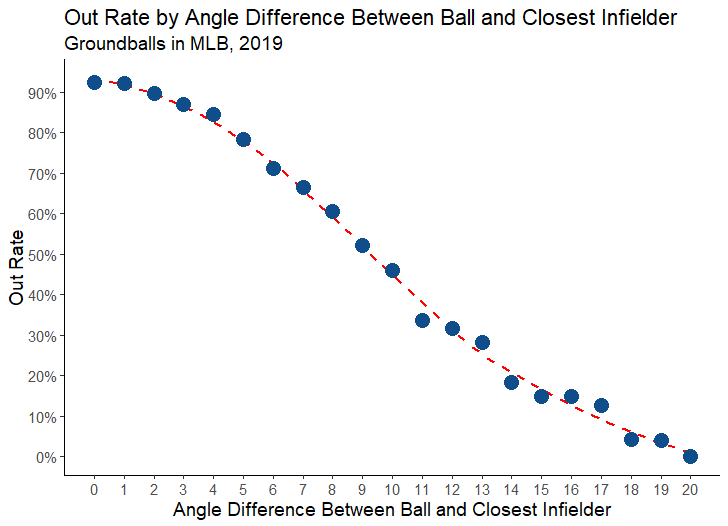
MLB’s Best Positioned Infields
By
Teams like the Astros, Rays, and Dodgers are aggressive in their positioning of infield defenders. Which teams have been best positioned in 2019?
-
Hall of Fame Value Standard shows Mike Mussina’s worthiness
By
Bill James has a new stat and an old stat that shows Mussina’s value well.
-
Who is baseball’s best backup catcher?
By
By EZRA RAWDON Having spent most of my career as a backup catcher at the scholastic and collegiate level, I have developed into a fan of MLB backup catchers. In an attempt to satisfy my curiosity on who might be the most valuable in baseball at the moment, I decided to dig in using some…
-

Why does Brett Gardner lead outfielders in Defensive Runs Saved?
By
By MARK SIMON Age is no hindrance to 34-year-old New York Yankees outfielder Brett Gardner. He currently leads all outfielders with 14 Defensive Runs Saved this season, if you combine his work in center field and left field. This is nothing new for Gardner, who saved 20 runs defensively in 2017, his third season with…