Sports Info Solutions
Tag: xander bogaerts
-

2026 Season Preview: Are The Padres A Good Defensive Team?
By
Manny Machado and the Padres feel like a middle-of-the-pack team defensively at the moment.
-
Stat of the Week: 10 Seasons Of Strike Zone Runs Saved Part II
By
Last week we looked back at 10 seasons of data for our pitch-framing stat, Strike Zone Runs Saved, which puts a run value on the result of taken pitches, and we looked at which catchers have fared best and worst in those measurements. One of the neat things about Strike Zone Runs Saved (SZRS) is…
-
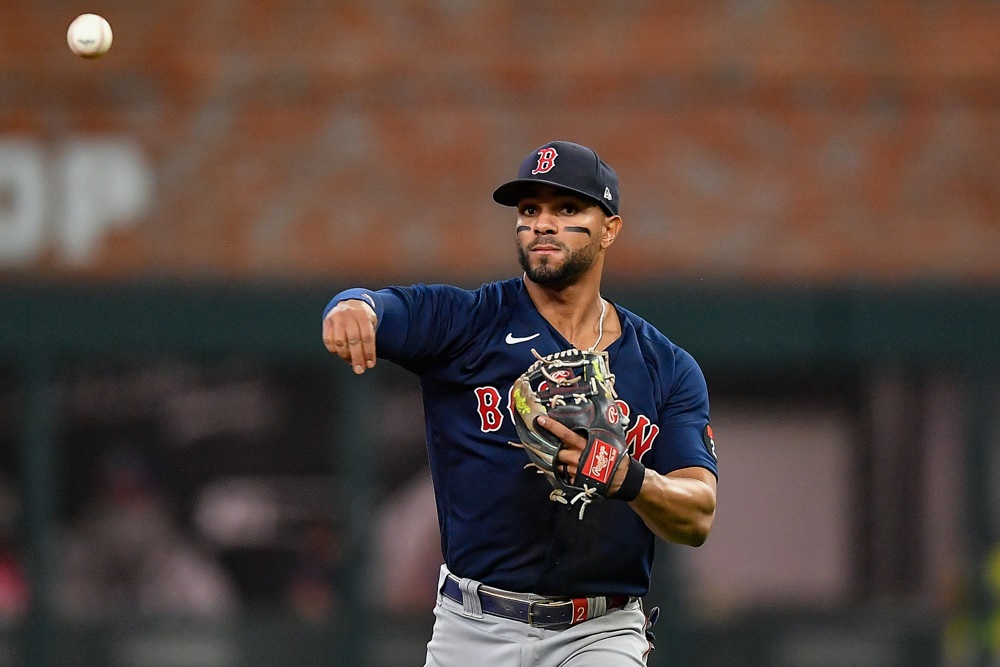
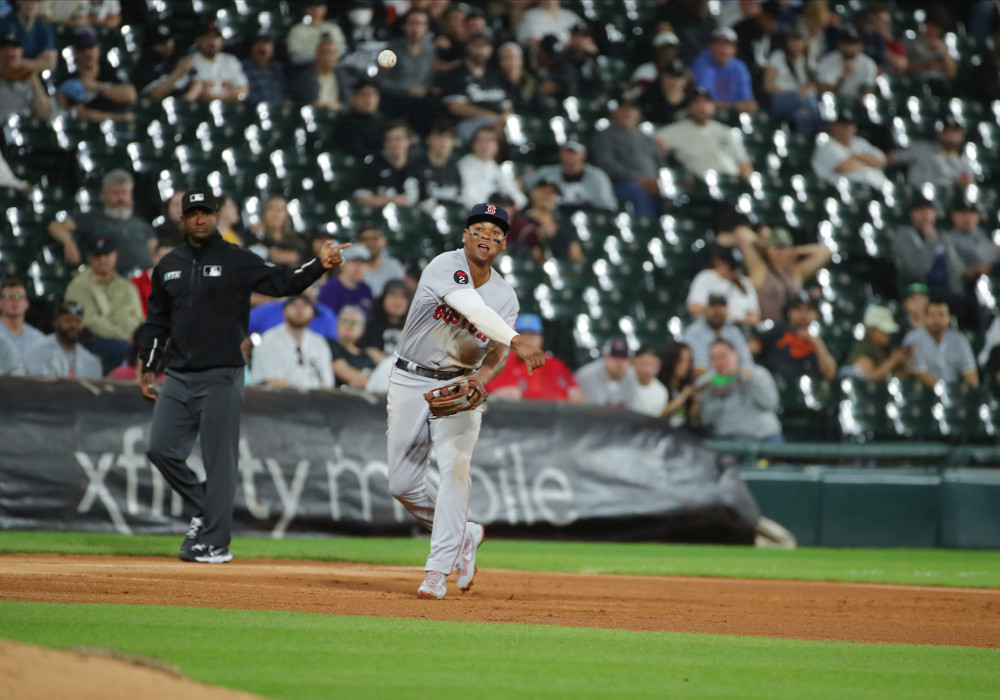
2023 Defender To Watch: Xander Bogaerts
By
The Padres have handed shortstop to a player who has made significant strides in his game, though one concern looms.
-
Bill James Handbook 2023 Excerpt: A Sizable Portion
By
We want you to buy the book! Here are nine snippets from essays by Bill James and our R&D staff.
-

3 Free Agents Projected With High Likelihood of IL Stint in 2023
By
We’ve collected years of data and created a model to assess injury likelihood.
-
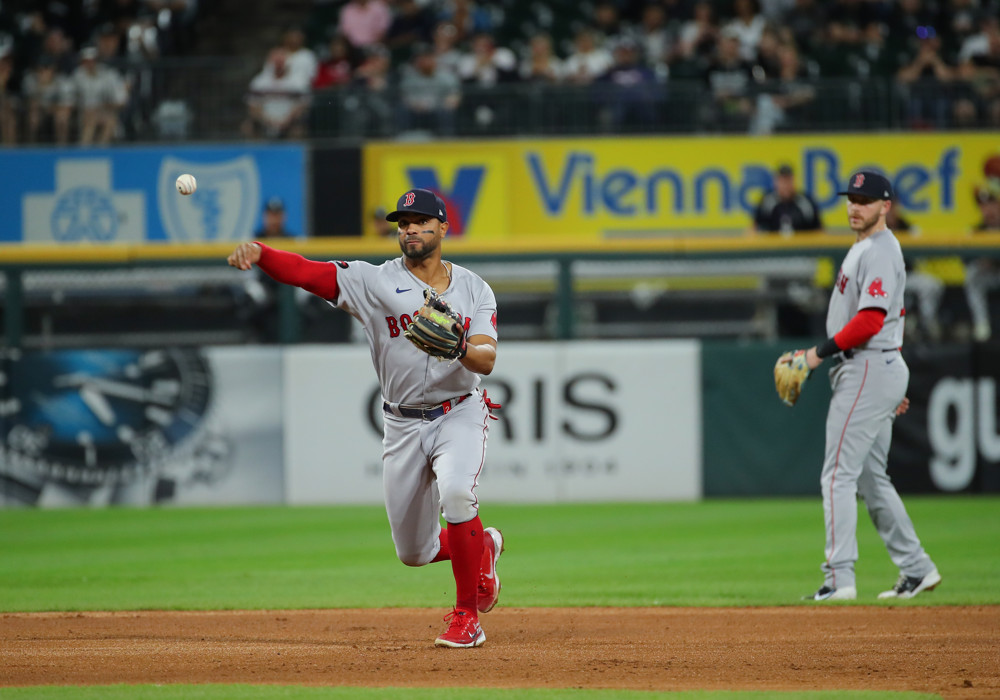
Turning a Negative Into a Positive: 5 Improved Infielders
By
Xander Bogaerts was among those whose Defensive Runs Saved totals reached new heights. How did it happen?
-
-

Which Players Have High Injury Risk in 2022? (Bill James Handbook Excerpt)
By
This Bill James Handbook excerpt lists and explains those players in our top 10 for 2022, and yes – Max Scherzer is on the list.
-
Who’s best/worst at going left and right?
By
Our metrics allow us to look specifically at the strengths and weaknesses of a player by direction.
-
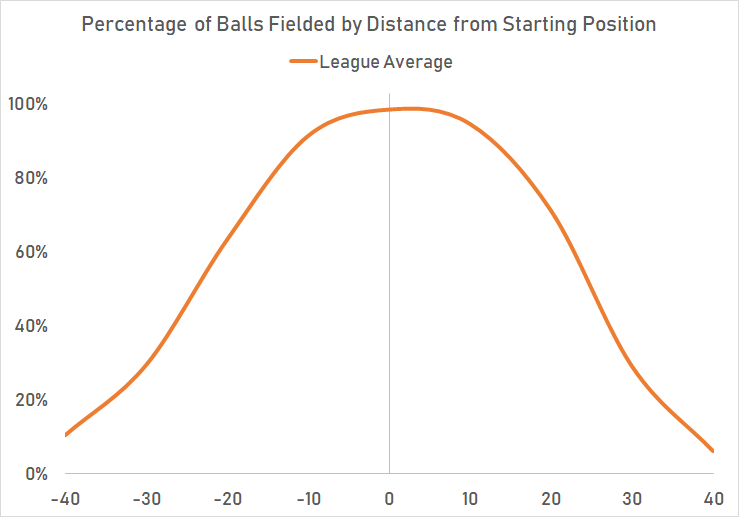
Visualizing Shortstop Range
By
A visual look at the lateral range of baseball’s best and worst shortstops.