This is an excerpt from the 2019 Bill James Baseball Handbook. You can purchase it online here.
By JOHN DEWAN
Reports of the demise of The Shift are greatly exaggerated.
Last year we reported on these pages that the number of shifts employed by Major League Baseball teams declined for the first time after five straight years of increases between the low of a 34% increase in 2015 and 93% increase in 2014.
Not no more.
Shift usage resumed its mercurial rise once again in 2018. Nearly 35,000* shifts were employed, an increase of 30% from 2017.
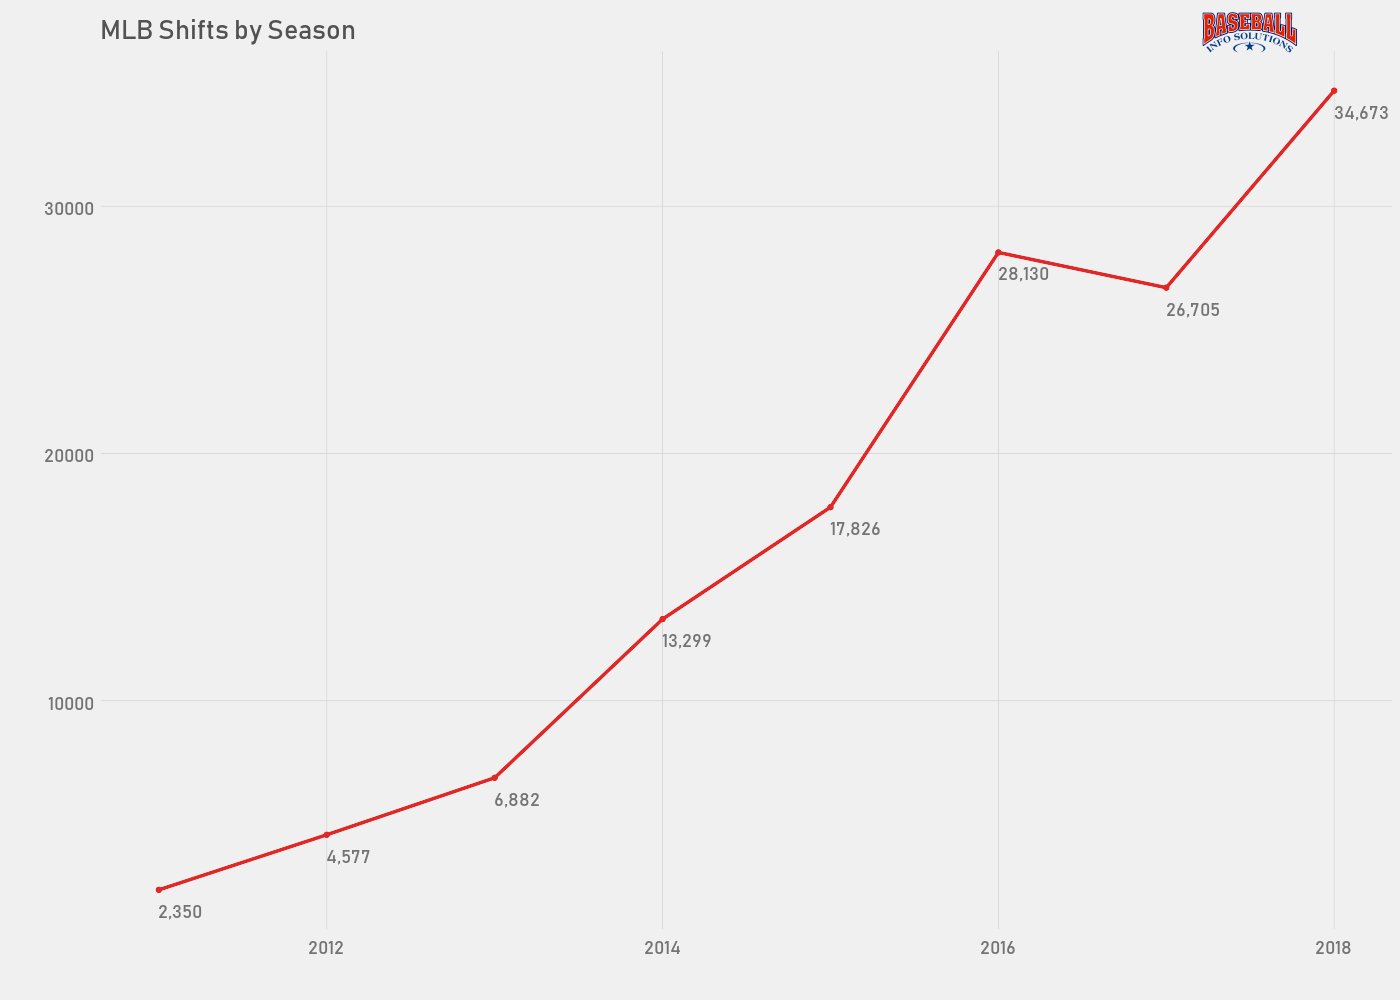
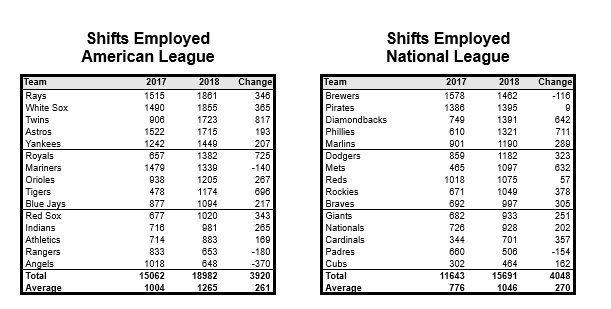
Twenty-five of the 30 teams in baseball increased their shift usage. One of the five who decreased was the Brewers, and they still ranked fifth in overall shift usage.
And more importantly, shift effectiveness exploded off the charts. Using the new technique developed by Baseball Info Solutions to evaluate shifts by comparing them to non-shift alignments, the number of runs saved per 100 shifts was at an all-time high in 2018 at 1.71 runs saved per 100 shifts:
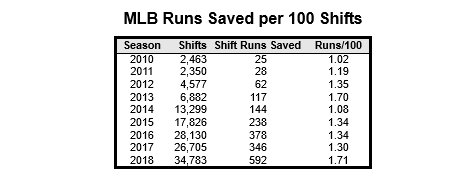
And yet, there is room for more! I expect to see 40,000 in 2019.
As noted in the August 30th edition of Stat of the Week.
While teams are shifting more than ever, there are still improvements that can be made. SIS’s BIS-D software provides a recommendation for every player in MLB as to whether that player is a shift candidate or not, and about one-third of shifts this season have been against players for whom the software recommends playing a standard defense. There have also been about 18,000 balls in play where the defense did not shift when the system suggested one.
How has the shift impacted the performance of those who get shifted? On the whole, the shift lowered shift candidates’ batting average on grounders and short line drives (BAGSL) by 23 points, while it had the opposite effect against all other batters, raising their BAGSL by 4 points.
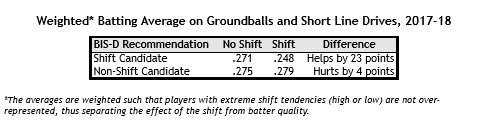
*The averages are weighted such that players with extreme shift tendencies (high or low) are not overrepresented, thus separating the effect of the shift from batter quality.
With shifts comprising a larger percentage of balls in play than ever before, it’s never been more important to make sure that the correct batters are being shifted.
Some additional observations (compliments of Baseball Info Solutions’ Mark Simon):
• The Royals, Phillies, Tigers, Mets, Cardinals doubled their shift usage from 2017 (the Cardinals still have a long way to go). Three of those five teams (Phillies, Tigers, Mets) had a new manager in 2018, while the Cardinals changed theirs mid-season.
• The Twins’ usage almost doubled. They ended up third in MLB in usage.
• The Diamondbacks led the majors in Shift Runs Saved (39). They ranked eighth in shift usage.
• When the A’s shifted, it worked really well. They ranked 25th in shift usage but second in Shift Runs Saved.
• The Tigers are a good example of how a shift can help an infield. Their infield combined for -14 runs saved in non-shift situations, but 31 in shift situations.
• The Yankees are another good example—their infield combined for -40 runs saved in non-shifts and 20 runs saved in shifts
• The Red Sox infield, too—it was at -60 runs saved, but they had 16 runs saved in shifts
• Four of the top six teams in shift usage won at least 90 games this season (Rays, Astros, Brewers, Yankees)
• Remember last season when the Rockies drastically reduced their shift usage? They raised it by 56% this season.
• Mickey Callaway’s increased shift usage may have helped Jacob deGrom. The Mets converted 56 of 65 ground balls and bunt grounders into outs when shifting with deGrom pitching. That 86% out rate in the shift ranked second in MLB to Zack Greinke (also 86%).
• Seven teams saved at least 20 runs with the shift this season. Only three did so in 2017.
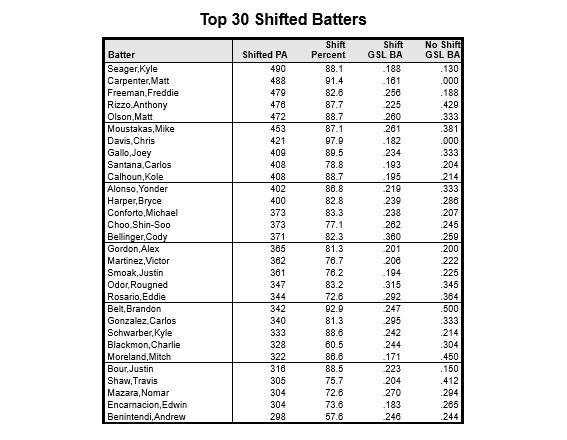
Finally, here is a team-by-team look at how often they are shifting, plus the list of the top 30 shifted batters and how they performed against the shift in 2018.