By Andrew Kyne
In 2018, Charlie Blackmon cost the Rockies 28 runs in center field, the worst Defensive Runs Saved mark in MLB. Of those 28 runs, 21 were lost by way of the Range & Positioning component of DRS. The only outfielder to cost his team more runs via Range & Positioning alone was Adam Jones (-25), then with the Orioles.
Both Jones (now with Arizona) and Blackmon have been moved from center field to right field in 2019. And thus far, their defensive results — while still slightly below average — have been better. Both are at -3 DRS (about -6 per 1,000 innings).
The numerical improvement as they move out of center field makes sense. DRS rates players relative to others at their position. They may have rated poorly among center fielders — but there are a lot of defensively-talented center fielders, and not as many defensively-talented corner outfielders. This idea is what constitutes the framework of positional adjustments for Wins Above Replacement.
Let’s take a look at these positional effects with DRS. How do center fielders rate when they move to a corner? How do corner outfielders rate when they move to center?
Dating back to when DRS began in 2003, I took all outfielders who played at least 700 innings (about half a season) at a position in one year and 700 innings at a different position the next year. I calculated each player’s Range & Positioning Runs Saved per 1,000 innings.
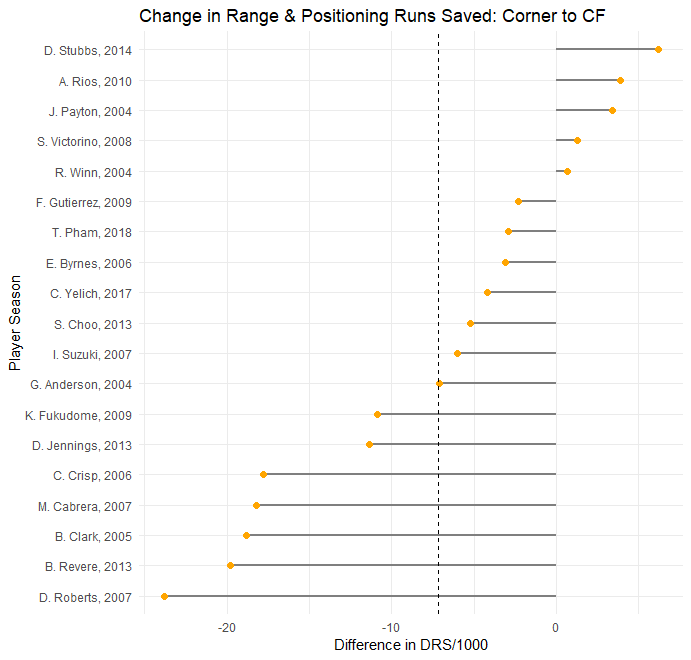
Here are the differences in Year 1 and Year 2 Range & Positioning Runs Saved per 1,000 for outfielders who moved from center field to a corner spot:
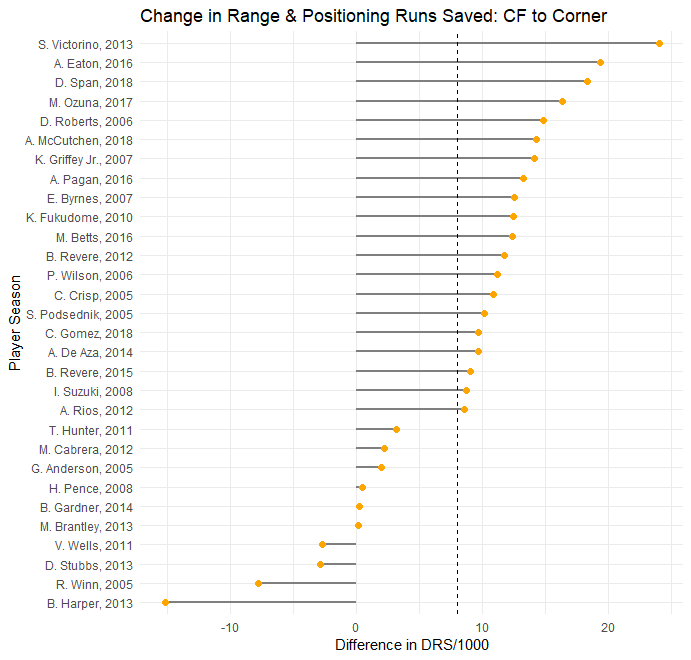
Of these 30 players, only four rated worse on a per-inning basis in Range & Positioning after moving to LF or RF. The average (represented by the dashed line) has been an improvement of 8 runs.
That’s a lot.
A player who can shift positions and perform better gives a team the flexibility to add a defender at his previous position that could be better than he was.
Here are the differences for outfielders who moved from a corner to center, an understandably smaller sample:
Of these 19 players, only five improved on a per-inning basis. The average has been a decline of 7 runs.
And let’s also look at players who moved from one corner to the other:
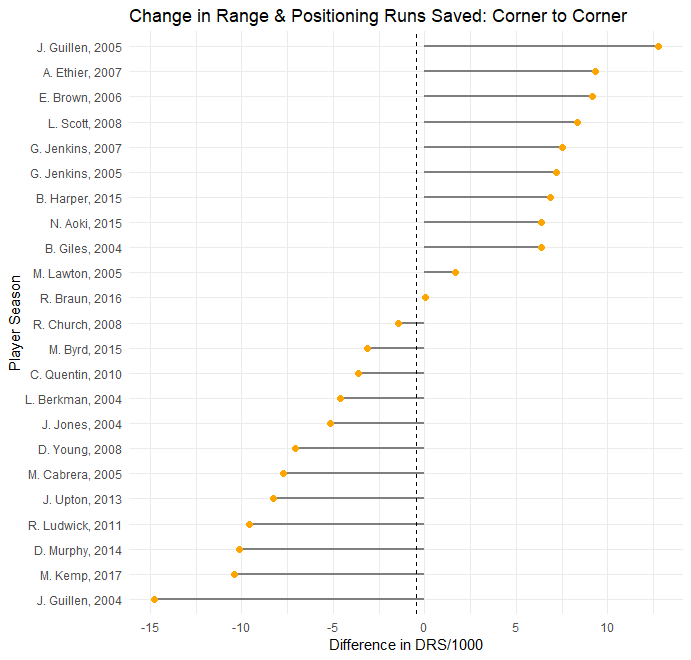
While there’s variation among these 23 players, the average difference is almost zero.
There are various other factors that affect year-to-year performance, including aging and ballpark effects. And while the samples are fairly small, there’s an obvious numerical impact on moving an outfielder into or out of center field. We’re seeing that with Charlie Blackmon and Adam Jones, who should finish 2019 with much better DRS numbers than they did in 2018.