by Jon Becker
On Friday, I identified which hitters have changed their hard-hit rates the most from 2018 to 2019, whether it came in the form of a large increase or large decrease. Now, I’d like to do the same with starting pitchers.
Note that this version of hard-hit rate is calculated as Hard-hit balls/(At-Bats + Sacrifice Flies). Our denominator rewards a pitcher for strikeouts. The denominator on Statcast and FanGraphs is “Batted Balls” which does not reward the pitcher for a strikeout.
The number you get from the calculation allows you to say “Pitcher X has allowed a hard-hit ball in Y% of the at-bats against him.”
I’ll start with the three pitchers who’ve improved their hard-hit rate the most. I set a minimum of 400 at-bats against in 2018 and 200 this season; 95 pitchers fit that criteria, though not all are starting pitchers this season.
1. Lucas Giolito, 26.5% to 20.2% (6.3% decrease)
It would be hard to argue that Giolito isn’t the most improved pitcher this season, and his large drop in hard-hit rate reflects that. His ERA has been nearly halved (6.13 to 3.15), with his K% almost doubling (16% to 30%). His most dramatic improvement has come with his signature pitch, the changeup: his hard-hit rate has dropped 11% on that pitch, from 27% to 16%.
2. Cole Hamels, 30.9% to 25.8% (5.1% decrease)
The Chicago renaissance continues for the veteran southpaw, who’s surely hoping that he won’t be on the shelf for too much longer with a mild oblique strain. In close to a full season’s worth of starts as a Cub, Hamels has been as good as ever:
29 starts, 2.71 ERA, 176 IP, 146 H, 171 K, 58 BB, 15 HR allowed
His hard-hit rate since being traded to the Cubs is 26.7%, putting him in 22nd place of the 64 pitchers who have at least 500 at-bats against in that time.
3. Stephen Strasburg, 22.0% to 17.0% (5.0% decrease)
Strasburg was 15th out of the 95 pitchers in our pool with his 22% had-hit rate in 2018, which is obviously excellent, but he’s taken it to another level in 2019. His 17% hard-hit rate is over 3% ahead of Giolito for best in MLB this year of the 95 qualifiers; the gap between him and Giolito is bigger than the gap between Giolito and Max Scherzer, who’s in 12th place.
Strasburg’s elite hard-hit rate puts him in company with much smaller samples–his hard-hit rate is similar to relievers Aaron Bummer, Kyle Crick and Jake Diekman, who’ve faced about 40% of the batters Strasburg has.
And now for the arms whose hard-hit rates have gone up the most:
1. Nick Pivetta, 22.6% to 33.5% (10.9% increase)
A common pick by analysts to break out in 2019 following a 2018 where he struck out 188 batters in 164 innings and, the Phillies righty has unfortunately gone backward this season, with an ugly 5.81 ERA in 12 starts and just 54 strikeouts in 66 2/3 innings. He’s been a bit better after a short minors stint, with a 4.84 ERA in eight starts, but he’s allowed 11 homers and still has a hard-hit rate of 28.4% in that time.
2. Mike Foltynewicz, 24.5% to 35.2% (10.7% increase)
Folty’s currently in AAA after an abysmal 11 starts with the big league club after coming off the IL, wherein he struck out just 7.6 batters per 9 (down from 9.9 last season). He allowed 16 homers in 59 1/3 innings, just one fewer than he allowed all of last season, when he completed 183 innings and faced almost three times as many batters. His time down at Gwinnett has gone somewhat better, with a 4.08 ERA in 17 2/3 innings, along with 19 strikeouts and four walks. He’s allowed 22 hits, but no home runs.
3. Kyle Freeland, 24.8% to 34.7% (9.9% increase)
Every year, we see pitchers who take pretty large steps back, but none in recent memory have fallen harder and faster than Freeland, who’s elicited memories of Steve Blass and Ricky Romero. After a 2.85 ERA in 2018 led to a fourth-place Cy Young Award finish and a staggering 8.4 WAR (per Baseball-Reference), Freeland began this year with a 7.13 ERA in 12 starts, allowing 16 home runs. He was then sent down to AAA to try to work out those kinks… where he then had an ERA of 8.80 in 6 starts. Undeterred, the Rockies brought him back up for a start on Saturday; he gave up nine hits and five runs in four innings, with a hard-hit rate of 30% (6-for-20).
Here’s the top 10 pitchers and bottom 10 pitchers in hard-hit rate change.
| Pitcher | HardHitRate 2018 | HardHitRate 2019 | HHR Change |
| Lucas Giolito | 26.5% | 20.2% | -6.3% |
| Chris Stratton | 33.9% | 28.5% | -5.4% |
| Stephen Strasburg | 22.0% | 17.0% | -5.0% |
| Kenta Maeda | 26.3% | 21.4% | -4.9% |
| Luis Castillo | 28.5% | 23.8% | -4.7% |
| Shane Bieber | 32.7% | 28.4% | -4.3% |
| Zack Greinke | 30.6% | 26.6% | -4.0% |
| Mike Minor | 29.6% | 25.9% | -3.7% |
| Tyler Mahle | 31.7% | 28.1% | -3.6% |
| Dylan Bundy | 25.1% | 21.8% | -3.3% |
Largest Increase
| Jake Arrieta | 21.6% | 29.9% | 8.3% |
| Zach Eflin | 22.0% | 30.6% | 8.6% |
| Vince Velasquez | 23.3% | 32.1% | 8.8% |
| J.A. Happ | 22.2% | 31.0% | 8.8% |
| Justin Verlander | 18.2% | 27.2% | 9.0% |
| Aaron Nola | 17.6% | 26.6% | 9.0% |
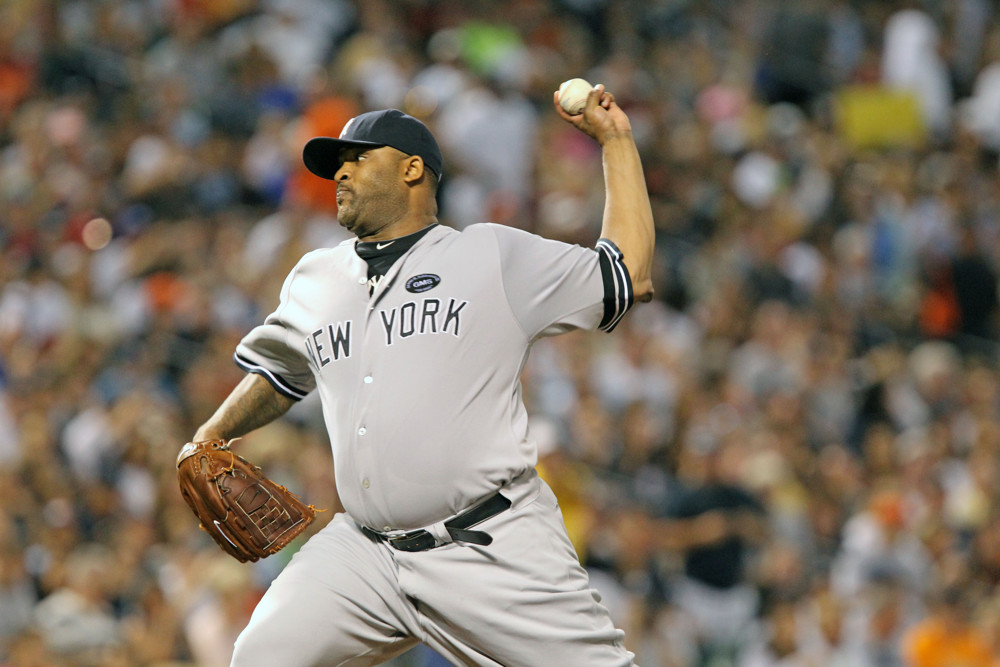
| CC Sabathia | 21.5% | 30.6% | 9.1% |
| Kyle Freeland | 24.8% | 34.7% | 9.9% |
| Mike Foltynewicz | 24.5% | 35.2% | 10.7% |
| Nick Pivetta | 22.6% | 33.5% | 10.9% |