by Henry Gise, 2021 Football Analytics Challenge Winner
Hog rate, as defined by Player Profiler, “captures the rate of passing game utilization [for an individual player] on a per-play basis by calculating the number of targets per snap.”
Hog Rate= Targets/Snaps
It can come into play when, say, a team has a group of tight ends whose individual contributions to the passing game differ heavily (e.g., a “blocking” tight end and a “receiving” tight end).
Thus, the defense might more easily predict where the ball is going based on tight end personnel.
My question is, can hog rate tell us where the ball is going based on player alignment?
For example, how did the frequency of slot targets change in 2020 when J.D. McKissic lined up there instead of any other player? How did McKissic’s target frequency change when he lined up in the slot rather than in the backfield or out wide?
Well, let’s see.
J.D. McKissic
| Position | Snaps | Hog Rate | Player Rate Elsewhere | Player Hog Rate Diff | Position
Hog Rate W/O Player |
Positional Diff |
| Backfield | 363 | 15% | 28% | -13% | 11% | +4% |
| Slot | 107 | 30% | 17% | +13% | 14% | +16% |
| WR | 62 | 27% | 19% | +9% | 12% | +15% |
We can see an increase in slot usage when McKissic lined up there, as indicated by the 30% hog rate he saw in the slot compared to the 14% rate the position saw otherwise. Likewise, when he lined up elsewhere, McKissic was targeted on just 17% of snaps.
So, two takeaways:
1) McKissic was far more likely to be targeted when positioned as a receiver (slot or wide).
2) The receiver position was far more likely to be targeted when McKissic lined up there.
I won’t pretend that this serves as some groundbreaking finding, as we commonly see this with backs who dominate the passing game.
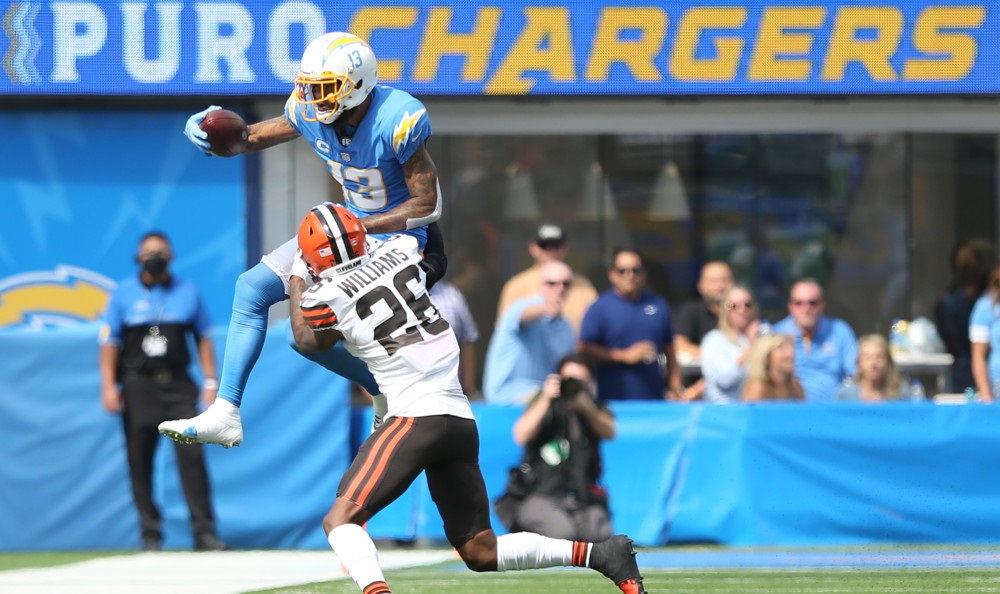
It does, however, give a starting point from which we can look for less obvious phenomena, the most prolific of which occurs when Keenan Allen is the Chargers’ right-most wideout.
Take a look.
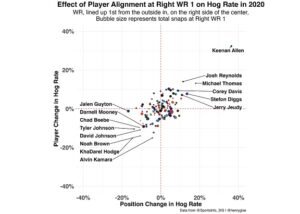
Allen saw a 36% increase when he lined up at right WR, and the position saw a 32% increase, decidedly the heaviest spread for any player anywhere in 2020. His 50% hog rate also blew everyone out of the water.
To clarify, Allen was thrown to on half of the 64 snaps he ran at right wideout, whereas every other Charger was targeted on only 14%. When LAC moved him wide right, they were very much trying to get him the ball.
If you’re curious as to whether or not it worked, he ranked 45th (in terms of EPA per target) out of 69 receivers with at least ten targets from right wideout. So, not really.
Let’s look at the rest of the leaders in positional hog rate differential.
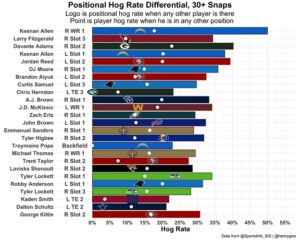
We can immediately see some noteworthy trends above, including the dominance of slots on this list. That’s primarily for two reasons:
- Slot receivers can be positioned 1st, 2nd, or 3rd from the outside, unlike WRs.
- Overall, slot target rates have increased in recent years across the NFL.
Also, three different teams appear twice in the top eight. Perhaps some offenses work harder to get certain people the ball, or maybe these teams are unintentionally overly predictable with their targets. Likely, it’s a bit of both.
How can we know? We can look at the effects of hog rate differential on EPA/target.
Did teams successfully improve efficiency by targeting specific players in the right spots?
Or is excessive predictability hindering offensive production?
Let’s see how EPA per target per position changed when targeting a player with a more drastic increase in positional hog rate.
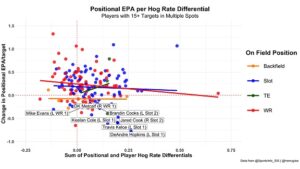
There’s a slight downward trend in all positions that aren’t TE (small sample size), implying that targeting those who get more targets-per-snap in that position does not work.
Is that right?
Travis Kelce, while having a much higher hog rate in left slot #1 than the rest of the Chiefs receivers, actually performs worse?
Yes, but –
His efficiency increased as he moved to left slot #1.
Let me explain.
Look at the differences in player-specific EPA/target rather than position-specific.
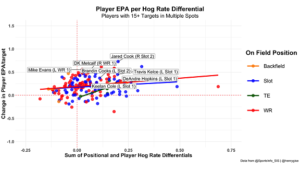
EPA for players tends to increase at the positions in which they’re getting more targets. Again, it’s only slight, but it seems to imply that when teams increase a player’s positional hog rate, his overall efficiency improves.
So, teams in 2020 heavily targeted players in positions wherein they were more effective, even if they may not have been the most effective player at that position.
This trend is likely to continue, especially with the pass-heaviness of today’s NFL and the aforementioned increase in slot usage over the past decade.
Offenses will continue to manipulate alignments to gain an edge, and, after all, every coach and quarterback wants to involve his best players.