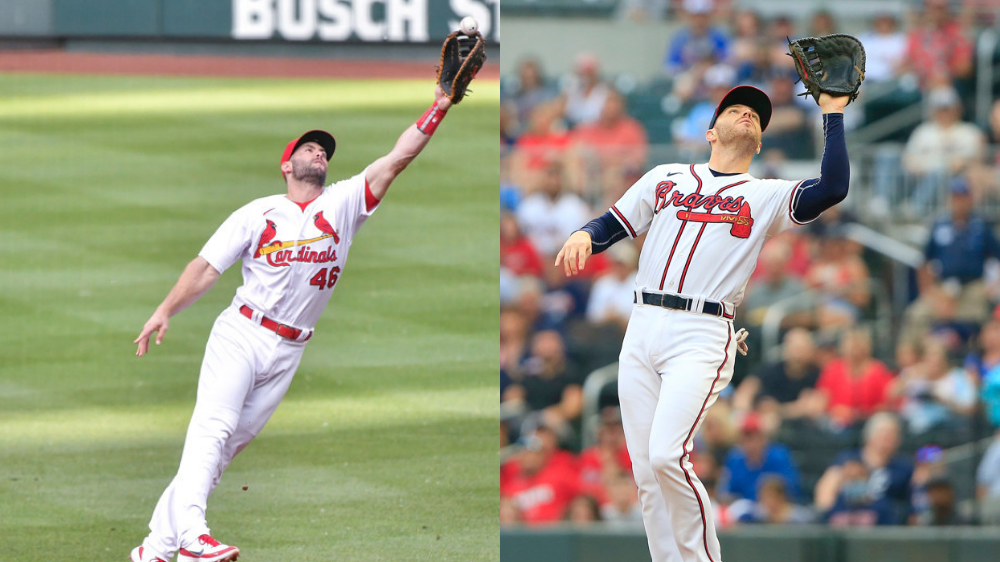
Over time, I’ve come across some Braves fans and media members who wonder why our Defensive Runs Saved numbers don’t rate Freddie Freeman more highly. And it’s fair to say what they’re asking is why Freeman doesn’t rate as a standard-setter at the position, like Paul Goldschmidt does.
So I looked, using 2021 as my basis for comparison.
The numbers
Last season, Goldschmidt outperformed Freeman in Runs Saved, 9-2, with Goldschmidt’s total tying him for the MLB lead among first basemen.
Taking the long view, the two of them rated just about even in 2019 and 2020. Freeman was MLB average. Goldschmidt was a run above.
Goldschmidt’s 2021 harkened back to his younger years. From 2015 to 2018, he saved 39 runs, an average of about 10 per season.
Freeman saved 18 in that span.
The difference between the two is in their range. Freeman is a better scooper of throws – in fact, he was the best in baseball last year. But the gap between them isn’t that large. The difference between him and Goldschmidt by our “scoops” methodology was one run in 2021.
The difference between the two of them on their respective ranges, specific to ground balls, is prominent (they rate the same on balls hit in the air).
The differential is 8 runs of defensive value.
In other words, there are more than enough ground balls hit their respective ways for Goldschmidt to make up for Freeman’s advantage in handling throws.
Range Rovers
What does an 8-run difference in ground ball range look like at the most basic level?
Take a look at this:
On Balls with a >0% Chance of Recording An Out
2021 Defensive Performance
| Name | Plays Made | Opportunities | Success Rate |
| Paul Goldschmidt | 181 | 318 | 57% |
| Freddie Freeman | 145 | 303 | 48% |
* Defining a “success” as a play made that resulted in at least one out.
Let’s break that down even further. Here’s a look at the combined value of every play Goldschmidt and Freeman made.
2021 Plays Made
| Name | Plays Made | Run Value |
| Paul Goldschmidt | 181 | 25.7 |
| Freddie Freeman | 144 | 24.1 |
On a per-play basis, Freeman matches up well with Goldschmidt. But
a) He didn’t have as many plays made
AND
b) as you’ll see below, Freeman had a lot more plays that he didn’t make. Here are the instances of the two being debited for not making a play.
2021 Plays Missed
| Name | Plays Missed | Run Value |
| Paul Goldschmidt | 137 | 18.1 |
| Freddie Freeman | 159 | 24.3 |
Right of Way
Teasing this out a little further, we can see that the big advantage for Goldschmidt comes in his making plays on balls hit to his right.
Goldschmidt converted 38% of plays made on balls hit to his right. Freeman converted 31%.
Goldschmidt converted 5 more than he was expected to make based on our out probabilities. Freeman converted two fewer than he was expected to make.
And when Goldschmidt made some of those plays, there was good value for doing so. Here are three examples:
1) Goldschmidt’s toughest play of the year came on a ball on which the out probability was 9%, a ground ball hit by Lorenzo Cain well over in the first base/second base hole.
2) Here’s one that Freeman experienced up-close. He was the batter – originally called safe on a play that replay overturned. The out probability on this ball was 19%. It’s a challenging play for a first baseman, who has to cover a lot of ground on a soft-hit ball.
3) And for good measure, here’s one more – a play that Freeman watched Goldschmidt make against his teammate, Ozzie Albies. It had a 41% out probability.
Goldschmidt made 27 of 35 plays on balls with out rates between 40 and 60%. Freeman was 24-of-36. A small difference, but notable when you’re asking why Freeman’s not the best at the position.
* And I want to cut off one thing that Braves fans may be thinking here: “Our team dramatically changed how it played defense in the middle of the season.”
This is true. But the question I’m trying to answer here encompasses the entire season’s worth of data:
“Why did Goldschmidt rate so much better than Freeman?”
How they play the position
Though Goldschmidt and Freeman are both playing the same position, they’re playing two different versions of the position. Here are two key differences.
- Goldschmidt plays deeper. With no one on base, Goldschmidt played an average depth of 121 feet from home plate. Freeman played an average depth of 114 feet.
The average MLB depth for a first baseman in that situation is 117 feet. Goldschmidt is 4 feet deeper. Freeman is 3 feet shallower.
Goldschmidt can play deep and handle the rockets and medium-velocity balls – and he can adjust and make plays on the soft-hit balls too.
The depth differential holds with runners on base too.
One example: With a runner only on first base. Goldschmidt plays an average depth of 89 feet (one step in after holding the runner). Freeman plays 86 feet (he comes in as the pitch is thrown).
2) The two differ in how they combine their depth with their width (how close to or how far away they play from first base)
A couple of examples
* Goldschmidt played much deeper than Freeman did when a left-handed batter was up and the team was not in a defensive shift.
1B Defense Left-Handed Batter at-Bat, No Shift On
| Avg depth (feet) | Avg width
(angle to home) |
|
| Goldschmidt | 128 | 38 degrees |
| Freeman | 118 | 36 degrees |
Here’s what that looks like, using visuals from Baseball Savant
And moving in the other direction, at the most extreme, there’s a 4-degree difference in where Goldschmidt plays vs where Freeman played when a right-handed batter batted with no one on base when their teams used a defensive shift.
This is what that looks like.
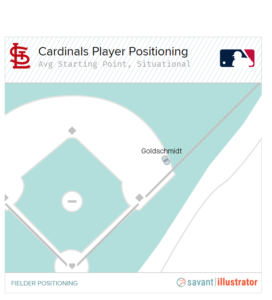
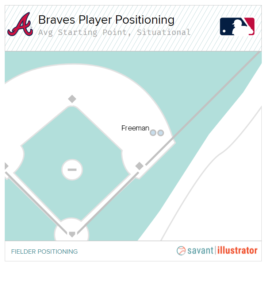
Point being: In most of the alignments that the teams play, Goldschmidt is a little more adventurous defensively than Freeman is both in depth and width.
Sometimes a little. Sometimes a lot.
And here’s what that does:
In previewing the Super Bowl on our company football podcast, my boss, Matt Manocherian, talked about how moving a safety around “changes the shape” of a team’s defense. And that the Rams and Bengals would play a chess game, trying to get the other team to change their shape.
Having Goldschmidt allows the Cardinals to change the shape of their defense for the better.
Here are two plays, one hard-hit and one softly hit, that Freeman misses that Goldschmidt probably makes.
And a play like this, on which Freeman has no shot, is one that Goldschmidt has a fighting chance at, because his skills allow him to play wider than Freeman does.
This is not to be overly critical of Freeman. He’s good. But we’re comparing him to the best defensive first baseman in MLB.
To get back to the idea of changing the shape of the defense:
The Braves’ and Cardinals’ second basemen align in part based on where their infield mates are playing. And they’ll align differently based on whether the infielder is Freeman or Goldschmidt. Essentially, the first baseman and second baseman become a unit and the performance of one can be linked to the other.
Let’s look at one thing related to the work of these units:
How often was an out recorded by each’s team’s defense on a ground ball between the first base bag, and the spot approximately halfway between first base and second base?
In this case, we’re asking how often did anyone make the play?
On Ground Balls Between 1B and the 1B-2B Approximate Midpoint
| Out Rate | MLB Rank | |
| Cardinals | 88% (219/248) | 4th |
| Braves | 82% (200/245) | 24th |
On the whole, the Cardinals unit was pretty good in this area. The Braves unit was not (and yes, the Braves d was better – 84% after the All-Star Break when they shifted more … again, we’re looking at the whole season).
Skill sets
With regard to skills, let’s note the difference between Goldschmidt and Freeman in certain fielding skills in 2021.
Forehand/Backhand Out Rates
| Forehand Out Rate | Backhand Out Rate | |
| Goldschmidt | 99%* | 94% |
| Freeman | 94% | 92% |
* Goldschmidt had 187 plays made on 189 opportunities he made when fielding the ball on his forehand
Additionally, Goldschmidt was the more aggressive of the two in both diving and sliding for balls.
When Sliding or Diving to Make a Play – 2021 Season
| Plays Made | Opportunities | |
| Goldschmidt | 15 | 28 |
| Freeman | 6 | 18 |
Goldschmidt’s willingness to dive or slide for balls extended his range in certain instances (such as on the play on Cain). It made a 9% out probability possible.
In fairness to Freeman, if we add jumping to the mix, he looks a little better. Goldschmidt totals 18 plays in which he left his feet and extended his range (on 33 attempts). Freeman had 13 on 27 attempts.
But he’s still not quite where Goldschmidt is.
And that’s kind of the point of everything we’re doing here.
It’s easy to say that Freeman was in Goldschmidt’s class.
But when it comes to trying to prove it, we can’t make the case, at least not in 2021.
Bottom line: They’re both great hitters and great players. One just happened to be a high-end fielder last season. The other wasn’t. But given that he’s got a World Series ring, he’s probably not complaining.