For the moment, let’s focus on baseball that we know will be played this season – Minor League Baseball.
SIS is an industry leader in Minor League Baseball coverage with advanced data collected from more than 5,000 games each season.
In 2018, SIS built a machine-learning model, Synthetic Statcast, that was trained using actual MLB Statcast data and SIS internally-collected batted ball data to simulate exit velocity, launch angle and more for MLB players back to 2010, as well as for the minor leagues, NPB (Japan), and KBO (Korea).
The result is a unique perspective on quality of contact for players across levels and how those players measure up to MLB standards.
Let’s look at a few of the top minor league prospects through the prism of that data. For now, we’ll focus on those not on 40-man rosters at the moment, meaning that they should be playing in the minor leagues come April.
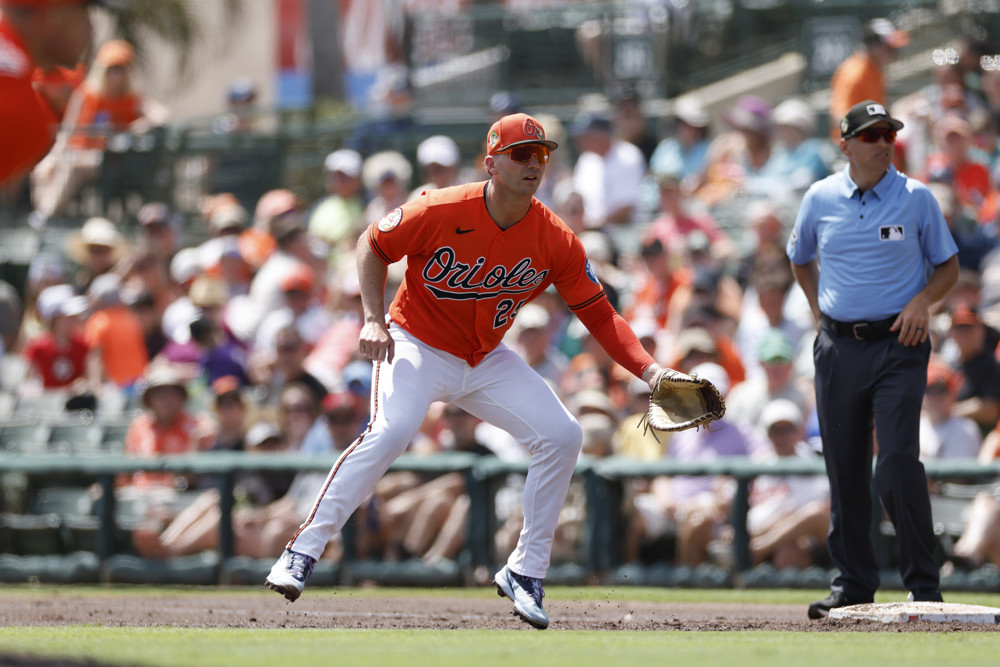
Let’s start with the No. 1 prospect on FanGraphs writer (and SIS alum) Eric Longenhagen’s Top 100 Prospects rankings, Orioles catcher Adley Rutschman. Rutschman hit .285 with 23 home runs, playing about two-thirds of his games in Double-A and the rest in Triple-A.
Our data also allows us to construct expected batting averages and slugging percentages on balls in play based on where balls are hit and how hard they’re hit. We can then compare a player’s actual batting average and slugging percentage on balls in play (BABIP and SLGBIP) to their expected numbers (xBABIP and xSLGBIP)
Rutschman’s BABIP and SLGBIP were .350 and .618 respectively, not far from his expected numbers of .347 and .608. His 86.5 MPH average exit velocity and 15.0 degree average launch angle resemble those of MLB catchers Kurt Suzuki (85.2, 14.6), Francisco Mejia (85.7, 14.9) and Tucker Barnhart (87.1, 15.5).
Rutschman’s value may be significantly enhanced by his glove, as he ranked No. 2 among minor league catchers in Defensive Runs Saved, a number that is largely driven by his pitch framing stats.
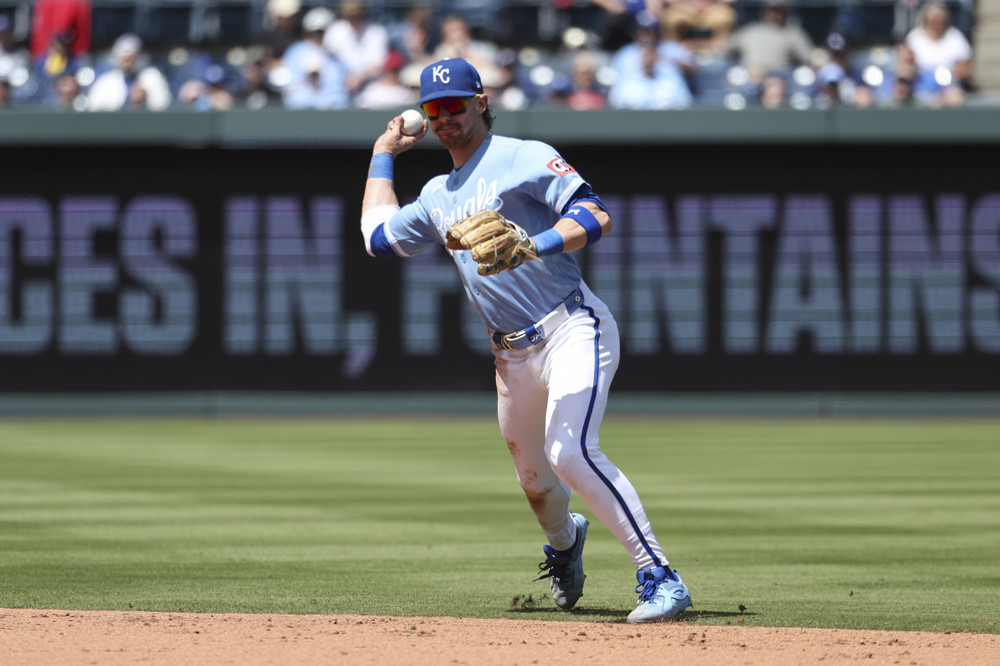
FanGraphs No. 2 prospect, Royals shortstop Bobby Witt Jr., had 33 home runs and a .936 OPS split almost evenly between Double-A Northwest Arkansas and Triple-A Omaha last season.
Witt had a .392 BABIP and a .775 SLGBIP. In both cases, he overshot his expected numbers, his xBABIP by 46 points and his xSLGBIP by 88 points. He overachieved more than his fellow top prospects.
Witt’s 88.5 MPH average exit velocity and 18.3 degree average launch angle are about the same as what Dodgers utility man Chris Taylor did in the major leagues last season (88.2 and 17.4, respectively).
The Tigers have the next-highest ranked prospects among position players not currently on a 40-man roster in corner infielder Spencer Torkelson (No. 4) and outfielder Riley Greene (No. 5).
Torkelson played at three minor league levels last season, finishing with 40 games in Triple-A. Overall, he hit .267 with a .935 OPS (brought down a little bit by hitting .238 with an .881 OPS at Toledo, his final stop).
Torkelson’s .359 BABIP was a near-match for his .365 xBABIP and his .731 SLGBIP wasn’t far from his .714 xSLGBIP.
Torkelson’s 90.1 MPH average exit velocity and 18.7 degree average launch angle are about the same numbers that Mookie Betts posted in MLB last season (90.3 and 18.9).
Greene split time between Double-A and Triple-A last season and handled the latter better than Torkelson did. Between the two levels, he hit .301/.387/.534 with 24 home runs.
However, Greene did overachieve a bit, particularly in slugging. His .775 SLGBIP was 104 points higher than his .671 xSLGBIP. His 89.6 MPH average exit velocity and 8.9 degree average launch angle were a close match to Marlins infielder Jazz Chisholm Jr.’s MLB numbers last season (90.2 and 9.0).
Look for more minor league content in this space as the season approaches.
Synthetic Statcast For Top Minor
League Prospects
| Player | Avg Exit Velo |
Avg Launch Angle |
MLB Comparable* |
| Adley Rutschman | 86.5 | 15.0 | Tucker Barnhart |
| Bobby Witt Jr. | 88.5 | 18.3 | Chris Taylor |
| Spencer Torkelson | 90.1 | 18.7 | Mookie Betts |
| Riley Greene | 89.6 | 8.9 | Jazz Chisholm Jr. |
Corey March also contributed to this article.
Note: Updated Bill James Projections are typically released on March 1 every year. However, given the current situation with the MLB lockout, 2022 updated projections will be released at a date to be determined once the lockout has been resolved and MLB team rosters have been settled.