Introduction
Every April, NFL GMs are given the task to take their allocated amounts of “draft selections” in efforts to better the team in both the short- and long-term. This process of player entry into the league is meant to increase parity and allow the formerly bad teams to get marginally better in a fair manner. Maximizing value in this process is a key factor in what teams continue to play football in February.
About 30 years ago, Jimmy Johnson devised a “draft trade chart” for the Dallas Cowboys, in efforts for the team to immediately evaluate draft pick trade offers. This chart became wildly popular, is still referenced by many, and has inspired a handful of spin-off iterations. Since the chart was made, four teams joined the league, the rules have changed dramatically, coaches are much more creative, and the NFL Draft process has improved immensely.
Instead of looking at the perceived value of picks, what if trade value came from the value that NFL teams actually got from those selections?
Total Points
Sports Info Solutions developed Total Points to value every player’s contribution to the team’s score. This complex metric was developed in 2018 and retroactively applied back to 2016. You can read its intricacies here. Instead of just empty stats, this measures the effectiveness of each individual player, to look at their stats in a much more critical manner.
Having a metric to define a player’s contributions to a team and matching that to where they were acquired in the draft, we can create a new version of the trade value chart.
Building the Model
Total Points begins in 2016, which will be our first evaluated class, and choosing to use the total points over a player’s first two years means 2021’s draft has to be ignored. Therefore, our dataset spans five drafts.
To determine the value at each pick, we have to consider that not all classes come with the same amount of talent, both overall and by position. With only five classes being considered, a wide net has to be cast in efforts to not allow individual players to affect the values too heavily. Thus, for each pick, we select the five years of Total Points earned from that selection, and the five adjacent picks in either direction, to get 55 Total Points numbers to gather information from.
With 55 values, from there we can eliminate outliers, both positive and negative. This is because the metric is looking for a single expected value, not measuring a ceiling or floor. For example, Gardner Minshew’s Total Points success from the 6th round should not tell us a 6th round pick has a lot of value, just as Paxton Lynch’s disaster from pick 26 shouldn’t say that’s a bad pick to own.
To achieve this for each pick, we eliminate the values of players either below the 20th percentile and above the 80th percentile to eliminate those anomalies. For draft selections with 55 players, this roughly gives 33 values to calculate an average of. This average is our data point representing the expected Total Points that a selection will return.
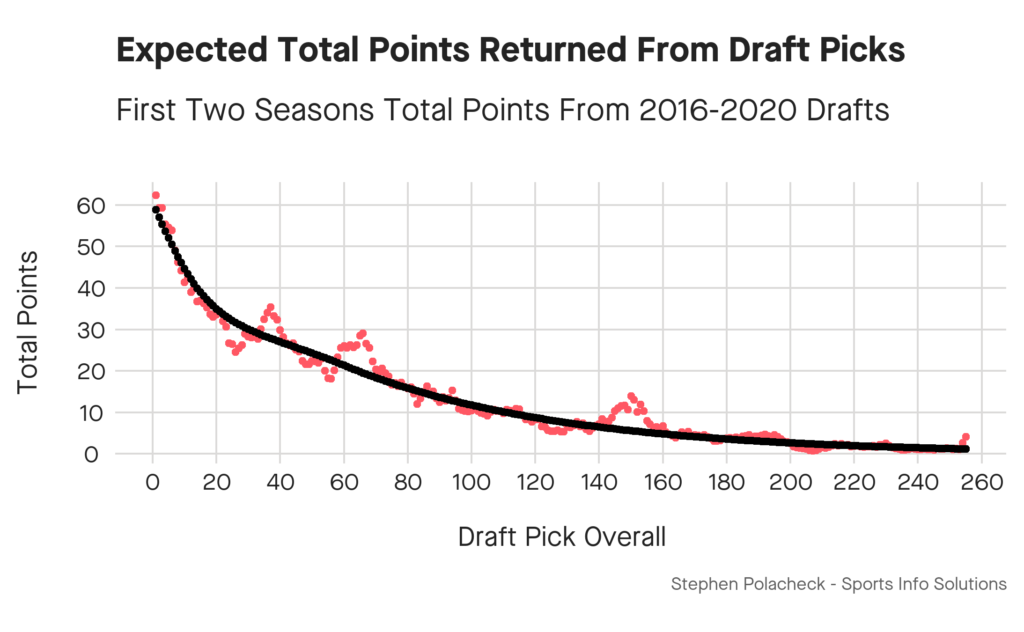
The model shown in black was developed using two separate models blended together. The first round being of such high importance, it couldn’t be represented based on influences from the 3rd round, so an exponential regression model was fit using early draft picks. The second model was a similar exponential regression model designed across the entirety of the data.
These are then smoothed together using a continuous gradual function to get a representative model. This gives us an Expected Total Points return based on the overall draft selection.
Takeaways
Likely one of the first observations made on the chart above is the “peaks” seen at the top of the first, second, and third round. These can be explained by players finding a much easier path to playing time in Years 1 and 2, as the teams selecting them theoretically have much less talent, and these players step right in as contributors. With more playing time, earning Total Points becomes much easier.
The trough at pick 26 can likely be explained by there being two QB selections, Paxton Lynch and Jordan Love, who returned negative and 0 Total Points respectively. The players doomed into minimal playing time will negatively impact the averages around that pick, even if on another team they would return a much better value.
The peak around the 150th pick is partially due to the small sample size of drafts. There are relatively more players returning 20+ Total Points than many adjacent picks–George Kittle, Demontae Kazee, Desmond King, Matt Ioannidis, Andrew Van Ginkel, Jordan Howard, and Hunter Renfrow to name a few. With more years of data, these picks will regress to the mean. With a smooth, monotonically-decreasing function, this peak appears when looking at the individual picks, but does not strangely influence the model.
Since 2016, 4 of the 5 drafts featured a QB going in spot number 1 (Jared Goff, Myles Garrett, Baker Mayfield, Kyler Murray, Joe Burrow). Naturally, quarterbacks accumulate the highest amount of Total Points, and immediate-impact QBs usually come from the top-end selections. However, there are plenty of picks in the top 10 of non-QBs to counteract this and give a real representation of expected Total Points.
One aspect important to the model is that no successive pick can exceed the value of a previous one. Every player taken at spot 50 was available at spot 32, so we shouldn’t follow and prioritize the NFL’s drafting mistakes if earlier picks occasionally outperform later ones. All-Pro LB Darius Leonard would have been a higher selection than 36 had the league known his talent.
The Improvement
Back to the originally presented Jimmy Johnson model. Can it be compared to ours? If we look at all picks’ value in comparison to the No. 16 pick (midway through the 1st round), we can compare the two models in the chart below.
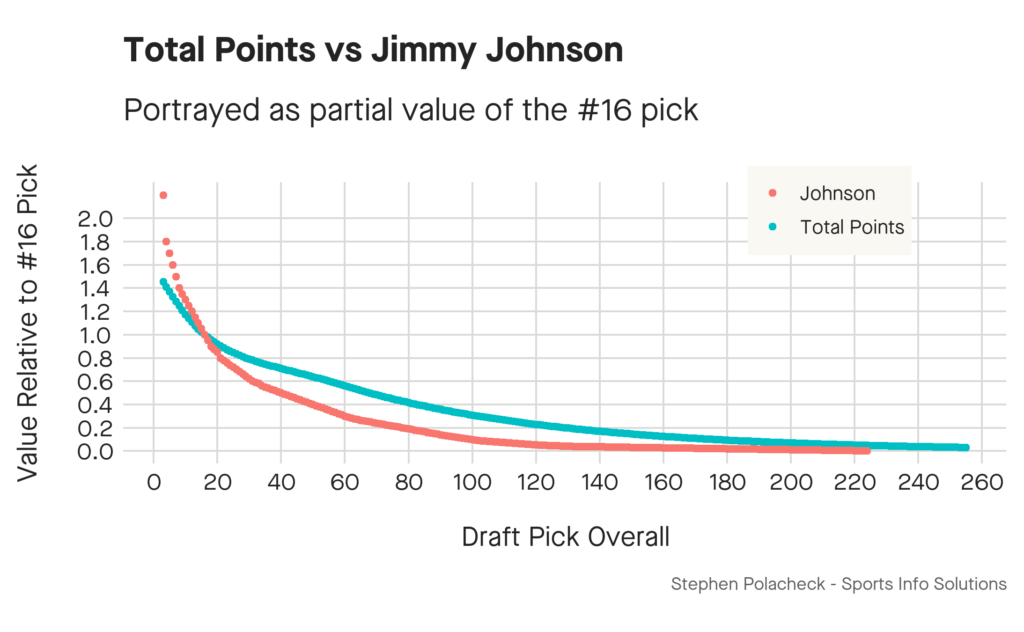
Johnson’s model counts early first round picks as significantly better than later ones, where it is much more smooth in the Total Points chart. The perceived value difference between picks 5 and 20 is much steeper in Johnson’s. This trend continues throughout the draft. Johnson’s scale sees the draft classes as much more top-heavy, and that the middle rounds do not bring anywhere close to the value of first rounders. Total Points, which is graded independently of draft capital, argues that the difference is much smaller than what may be perceived.
It should be noted, however, that Johnson’s chart is designed with pick value in mind. His chart could theoretically be accounting for a player’s potential upside, while the designed Total Points model is looking at expectation, in what a player likely returns. This could potentially explain the value difference of picks at the very top of the draft.
In application, if I have a selection around the 10th pick I’m doing everything I can to secure later 1st, 2nd, and 3rd-round picks. My net gain from the draft class will likely be significantly higher than if I stay at the 10th pick. But would teams actually do this, trade all that to move up a few spots? Yes, they do!
In the 2021 NFL Draft, the Minnesota Vikings came on the clock with the 14th pick. Instead of making a selection, they traded the pick to the New York Jets. The trade ended up being picks 14 and 143 in exchange for 23, 66, and 86. Mapping the expected Total Points return, the Vikings took 46.1 Total Points and exchanged it for 67.2 Total Points. This is a fantastic deal from the Vikings, and a massive waste of value from the Jets.
In Conclusion
The draft is much more of a gradual exponential function than what is normally perceived. Rounds 2 and 3 hold a ton of expected value in building championship teams, and those can be the best bang-for-your-buck selections in the entire weekend.
In general, trading up for a future starting quarterback would be a positive Total Points value move. They are so important to a team’s success that moving up the board to secure yours is well worth the investment. Otherwise, it’s best to sit tight and let the draft come to you, and move back to maximize it.
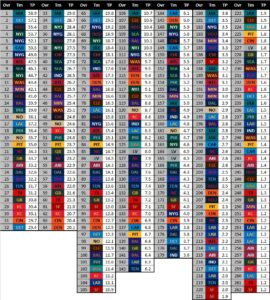
It wouldn’t be an analysis of draft pick trade values without sharing a chart for the 2022 Draft. What would you do with your team’s picks?
Draft picks as of 4/4/2022. 5:00 PM EST
