One of the things that helped the Giants win 107 games in 2021 was that it seemed like for every ground ball and line drive hit against them, their infield defense was well positioned to handle it.
The 2022 Giants have been similarly very well positioned. In fact, by our data, they’ve again been among the best-positioned infields in the major leagues this season.
Most Defensive Runs Saved From Infield Positioning – 2022 Season
| Team | DRS |
| Giants | 32 |
| Dodgers | 32 |
| Astros | 24 |
| Braves | 22 |
| Rangers | 21 |
So how do we know this?
The way we calculate positioning value is
- A) We calculate the out probability of a play using the variables available from our ball in play tracking. Those inputs for balls hit on the ground include where the ball was hit, how hard it was hit, whether the defense was shifted, and how fast the batter is.
And then
- B) We recalculate that out probability, adding the input of where the player was positioned.
The positioning value, calculated in both plays saved and runs saved both in totality and on a per-play basis, comes from simple subtraction: B minus A.
So for example:
A ground ball up the middle may have a 50% out probability for the second baseman if we don’t know where he is positioned and presume “average” positioning.
But if we know where he is positioned, which for the purposes of this example can be “behind second base” we can recompute the out probability to 90%. Thus, then we know the positioning value of the play to be .4 (90% minus 50% to reflect how much the out probability improved). The run value is then computed accordingly based on where and how hard the ball was hit to account for whether the ball might have been an extra-base hit.
If on that same ball, the out probability went from 50% to 20% once we knew the second baseman’s positioning that would be an example of bad positioning. The team would be dinged .3 positioning plays saved (50%-20%).
Here’s an example of good positioning.
The out probability of this ball if we presume average, straight-up positioning is 20%. But because of where Estrada is positioned, that probability jumps to 96%. The Giants thus get a .76 positioning plays saved credit for that, which converts to about 0.6 runs saved.
Teams whose positioning often matches where balls are hit rack up a lot of positive credits in this stat. Teams whose positioning doesn’t match where balls are hit accumulate lots of debits.
But here’s the rub with the Giants.
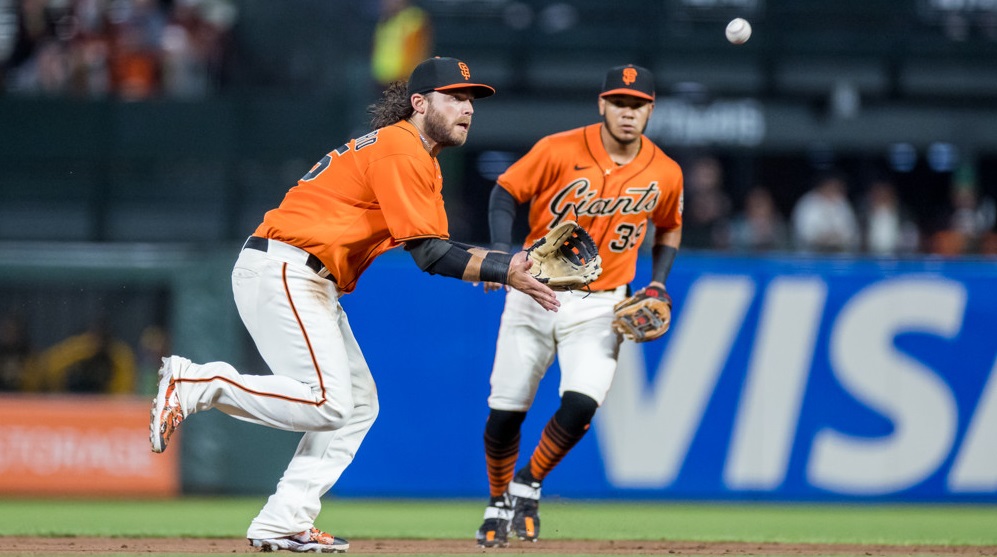
In 2021, they had excellent positioning and had solid skill at shortstop with Brandon Crawford. They had below-average skill at first base, second base, and third base, but their positioning helped covered up some of their weaknesses.
In 2022, the positioning’s been excellent again. Look through video and you’ll see a lot of at-em balls. But a team can be good at positioning and not do well at out-getting.
For the Giants, there’s been a little more of this
some of this
and a little of this
In 2021, the Giants turned 74.5% of ground balls and bunts into outs. That was basically a match for their expected out rate, which we calculate by compiling the out probabilities of every play.
In 2022, the Giants rate of getting outs has dropped to 72.4% against an expected out rate of 75.3%. In other words, for every 100 ground balls and bunts hit against the Giants, they’re getting about 3 fewer outs than expected.
That’s especially problematic given that the team induces the highest percentage of ground balls in MLB, a total above 1,500 for the season.
If the Giants had converted these balls into outs at the same rate in 2022 that they had in 2021, they’d have converted 32 more plays than they actually have.
The Giants have given away nearly all of their positioning advantage because their infielders aren’t getting outs. The combined Runs Saved totals of their first basemen, second basemen, third basemen, and shortstops is -32, second-worst in MLB.
The Dodgers leap ahead of the Giants in that stat if we rank teams on a per-play basis*. They’re not necessarily the most skilled infield defense either, but they’ve fared better overall than the Giants have.
* The top five teams in Infield Positioning Runs Saved are the same in the aggregate as they are on a per-play basis, just in a slightly different order.
The Dodgers are the most aggressive shifting team in the major leagues, as nearly 53% of balls in play against them have come against a Dodgers defense that has three infielders on the pull side and 81% of balls in play against them have come against either a full shift (three infielders on the pull side) or partial shift (two infielders deviating from normal positioning).
Teams that shift a lot are going to have the most opportunities to greatly impact their positioning Runs Saved because of how dramatically they alter their positioning. But they still have to shift smartly in order to garner good results over a full season.
That the Dodgers’ positioning has been as good as it is plays a larger role in why they are above the MLB average in turning grounders and bunts into outs at 74.8% (MLB average is 73.9%).
The Astros, Braves, and Rangers are the next three best teams in Infield Positioning Runs Saved. Both the Braves and Astros are of similar result patterns – a solid to standout defensive shortstop (Dansby Swanson and Jeremy Peña), with good positioning covering up any shortcomings at other spots.
Justin Verlander is acutely aware of how good the Astros have been. He has gotten the 4th-most positioning support in MLB and that includes plays like the one in this first clip here.
The Braves’ switch to a much more aggressive strategy with defensive shifts is well documented. Fair to say that they’re happy with the results this season, given that they rank 5th in the majors in turning ground balls and bunts into outs.
And yes, positioning helps on line drives too
The Rangers infield is on pace for similar overall numbers – when combining skill and positioning – as it had last season. But how they got to that total differs.
In 2021, the skill of players like Isiah Kiner-Falefa accounted for the majority of their Runs Saved. In 2022, with the change over to Corey Seager at shortstop and Marcus Semien at second base, the sum of the Runs Saved totals of their infielders is 0. They rate as high as they do in terms of their overall infield Runs Saved because their positioning has been better than 2021.
To round out this piece, here’s where every team ranks in Infield Positioning Runs Saved this season.
Most Infield Positioning Runs Saved
| Team | Positioning Runs Saved |
| Dodgers | 32 |
| Giants | 32 |
| Astros | 24 |
| Braves | 22 |
| Rangers | 21 |
| Brewers | 20 |
| Mariners | 19 |
| Red Sox | 19 |
| Tigers | 18 |
| Diamondbacks | 17 |
| Padres | 17 |
| Blue Jays | 16 |
| Yankees | 15 |
| Angels | 15 |
| Twins | 14 |
| Rockies | 14 |
| Marlins | 14 |
| Nationals | 14 |
| Mets | 12 |
| Guardians | 12 |
| Phillies | 10 |
| Cardinals | 10 |
| Pirates | 8 |
| Rays | 8 |
| Cubs | 7 |
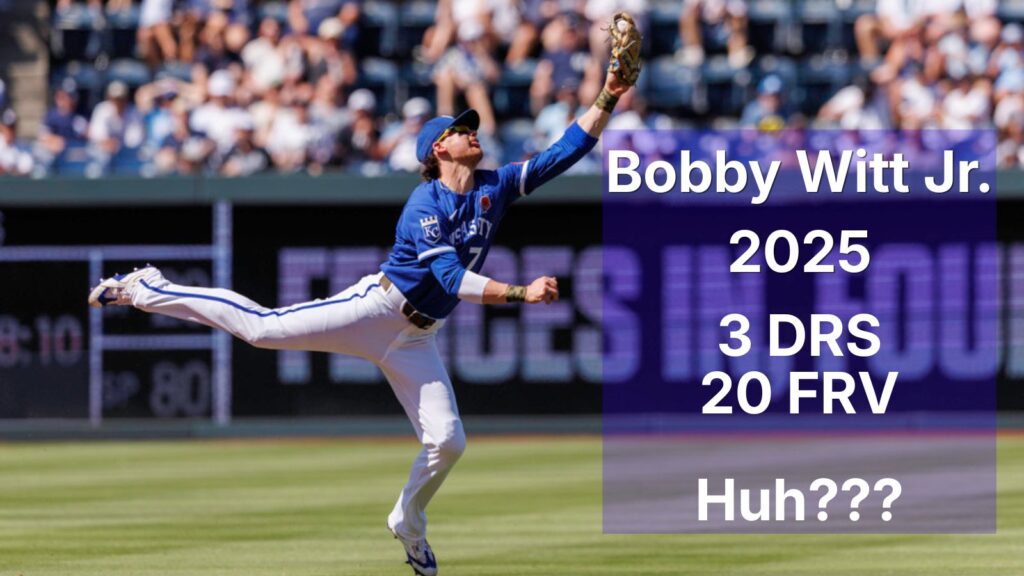
| Royals | 7 |
| Orioles | 7 |
| White Sox | 7 |
| Reds | 3 |
| Athletics | 2 |