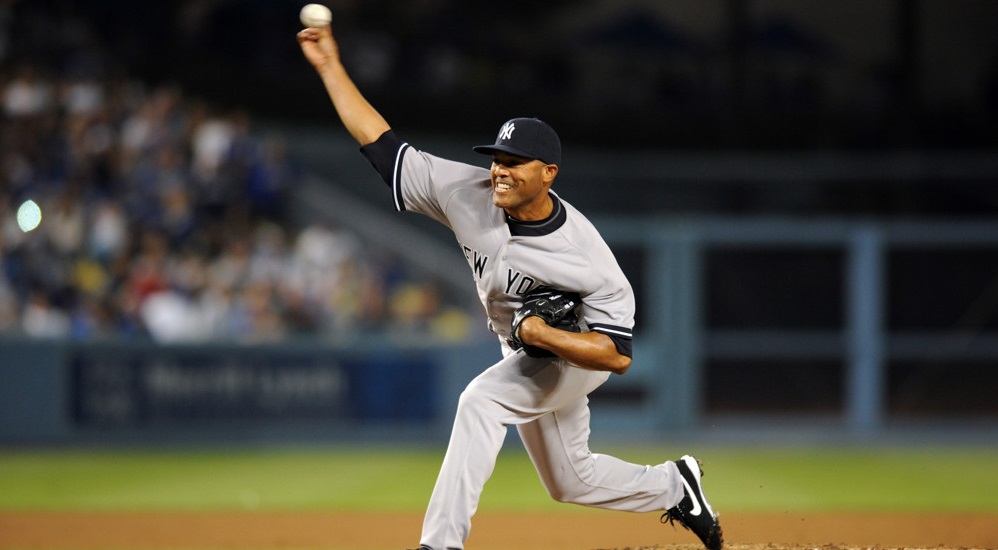
Growing up a Yankees fan, the term “broken bat” became synonymous with “Mariano Rivera” for me. The Yankees’ close-out artist made a living inducing weak contact with his signature cut-fastball, not necessarily missing bats but certainly missing barrels.
Rivera’s signature offering inspired pitchers from Roy Halladay to Mark Melancon. But nobody broke bats like Mo. In fact, our data on broken bats indicates that on average, throwing more cutters has no effect on the number of hitters’ bats a pitcher saws off.
Because our data is entered by manual scorers, only the obvious broken bats are captured by the majority of stringers. This is an important stipulation to note before I present my findings.
I narrowed the number of pitchers in my analysis down to the 377 who allowed at least 100 instances of contact, or broken bat opportunities, in each of 2021 and 2022 (through August).
For the 377 pitchers, the raw number of broken bats from 2021 significantly predicted the number of broken bats in 2022. Specifically, each broken bat a pitcher netted in 2021 portended 0.74 more broken bats for them in 2022 on average, explaining 22.3% of the variance in the metric across the seasons.
I first looked at cutter percentage as reported by Statcast, which did not significantly predict the number of broken bats in either 2021 or 2022.
While I was surprised by this result, it also confirmed something we already knew: Mariano’s cutter was special. To put some numbers on its uniqueness, Baseball Prospectus’ PitchFX leaderboards go back to 2007. Since 2007, 196 pitchers have thrown at least 1000 cutters. Mo’s piece ranks in the top 20 in velocity, horizontal and vertical movement, and fouls per swing. And this is just looking at the last seven years of his career, starting with his age-37 season.
Were there any offerings that did significantly increase the number of broken bats on average? For 2021, sinkers did. A 1% increase in sinker usage last year portended 0.03 more broken bats on average. While this effect seems small, it received its statistical significance by showing up consistently throughout the 2021 sample. So far this year, more sinkers have not significantly increased the number of broken bats, but they have continued to significantly increase the rate of broken bats per contact.
What’s more, increased four-seam fastball usage led to significantly fewer broken bats on average in 2021. This is likely because sinker usage often increases at the expense of four-seamers, and sinkers were breaking bats aplenty last year.
Sinkers, sort of like anti-cutters, similarly mirror fastballs but move to the pitcher’s arm-side in opposition to the typical cutter’s glove-side tilt. Essentially, the traditional maxim that cutters break bats may not be that far off; it just got the direction of horizontal movement wrong.
Broken bats are likely more attributable to unanticipated horizontal movement (in on the hands) than any other pitch characteristics. Typically, a broken bat will come when a batter guesses correctly in terms of pitch speed and vertical location but fails to pin down horizontal locale.
This will most often occur when a hitter expects a four-seamer but receives a four-seam alternative. Of the two most frequent alternatives, on average, sinkers have far more horizontal movement than cutters. While Mo’s cutter had good rise, its excellent horizontal movement even at the tail end of his career is likely the reason it broke bats.
Just don’t expect the typical cutter to do so.