With the end of the 2022 season, there are now 20 available seasons of Defensive Runs Saved data. This winter, we’ll be looking more closely at those numbers, looking both at what they tell us and what they don’t tell us.
But before we do that, we wanted to go back to where it all began in this Q&A with Sports Info Solutions co-founder John Dewan, who led the team that invented Defensive Runs Saved.
Mark: Who is the first defensive player you saw that made you say, ‘I want to be able to better quantify his value?’
John: The first player that I wanted to better quantify defensive value was Reggie Jackson.
Because in Strat-O-Matic, he was a ‘1’ one year, which is the best rating you can get. Then the next year he was a ‘2’, which is above average, and the next year he was a ‘3’, which is average, and next year a ‘4’, which up until that time was pretty much the worst you can get.
So in four consecutive years, he went from best to worst. Strat does a really good job in trying to do their defensive ratings. And Reggie was on my team and I’m like, wait a minute, why is he changing every year?
Their defensive ratings were very good, but I wanted to understand it better. All we had was fielding percentage and then Bill James came out with range factors and I just wanted to do more and more.
I was directing Project Scoresheet in the 80s and I came up with, I don’t know what I called it, adjusted range factor or something where I factored in the handedness of the pitcher, where when a lefty is pitching, more righties will be in the lineup and they would pull the ball on the ground. So if you have a lefty predominant pitching staff, the left side of infield gets more chances, or right predominant, the right side of infield gets more chances.
So, I created a system that adjusted for that, because that’s the data we had with Project Scoresheet. We didn’t have the location of a batted ball, but we did know how many innings were faced against lefties and against righties. So I adjusted for that. In the 90s, when we were at STATS, we had the location for every ball, and I came up with Zone Ratings and then the precursor to the plus-minus system with the Ultimate Zone Rating.
That (UZR) was something that Mitchell Lichtman continued to do. Zone Ratings, Chris Dial continued to do that.
Mark: How did you get from there to Defensive Runs Saved?
John: We focused on the plus-minus system in the first Fielding Bible book. That is the most important element within DRS.
And then in the second Fielding Bible, which came out in 2009, that was the launch of Defensive Runs Saved. That’s where we said, all right, we’ve got to translate the numbers that we’ve been coming up with into the currency of baseball, which is runs.
Mark: How did you get there? Phone calls, e-mails?
John: That was me working with our research department and researching all the different elements we want to put into it. Ben Jedlovec (now at MLB) was the key person then. Steve Moyer was running the company. Pat Quinn did a lot of the work with me and Rob Burckhard.
Mark: How did you figure on adding things like double plays, bunts, catcher components like pitch framing?
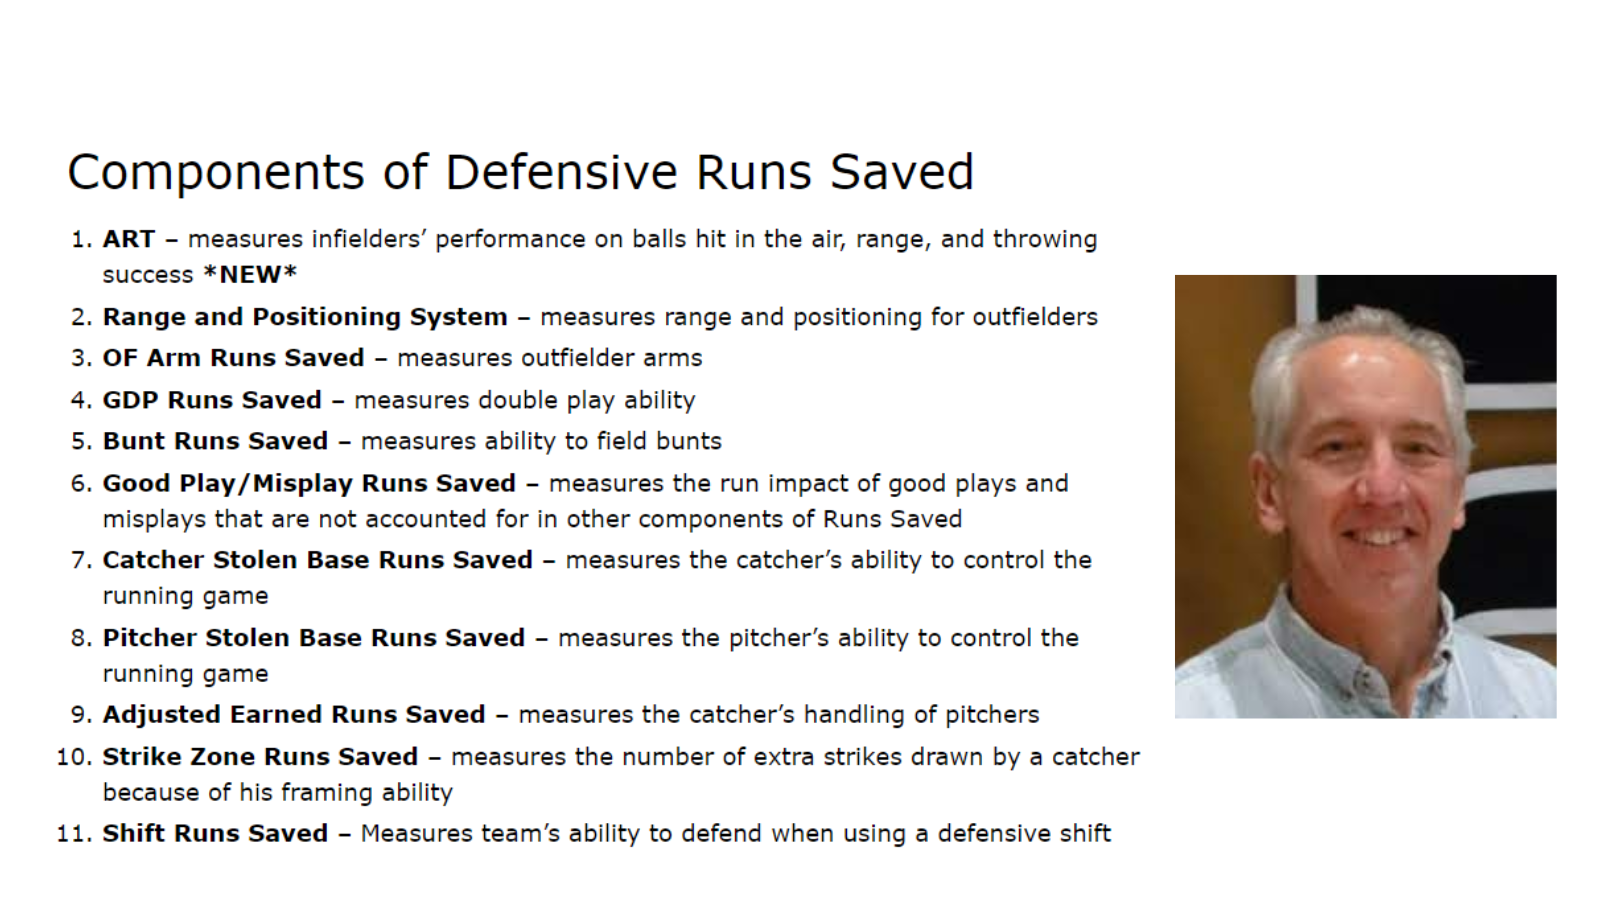
John: The plus-minus system was the key but there are other defensive elements. We have a Good Plays and Misplays system, tracking first base scoops, missing a relay throw, things like that.
We just tried to look at things that the plus-minus system doesn’t capture and, you know, tried to come up with something that measures every element of defense.
Mark: How did you figure out the idea of categorizing fly balls, liners, and then another subgroup called “fliners”?
John: We went with five different distinctions between fly balls and line drives, which made the plus-minus system better because it was harder to catch a liner than a fly ball if it’s hit to the exact same location.
Mark: Is there a concession with the early version of Runs Saved that positioning is essentially incorporated into it for the player but more recently, positioning is awarded to the team?
John: Exactly. The early version of Runs Saved, the fielder got credit for good positioning if he was positioned at a good spot. Later on we separated that into a team element and a player element.
Mark: So is it a little odd to compare 2005 Runs Saved to 2020 Runs Saved?
John: If you’re an absolute purist, yes. But remember there wasn’t as much shifting back then, so positioning wasn’t as important as it is now. And the player positioned himself in a lot of cases. So he should get the credit for that.
I remember the story about Cal Ripken where he would make sure he knew the pitch that was being called. And so his positioning was based on the pitch type.
If it was a breaking ball, he knew that the pitch was more likely to be pulled than if it was a fastball. I don’t think was very common then.
Mark: What was the hardest thing to figure out for Defensive Runs Saved?
John: We won an award at Sloan for Strike Zone Runs Saved (our pitch framing stat). That took a lot of work. There was an iterative process on how to split the data between the four principals – the pitcher, the catcher, the umpire and the hitter. Prior to that, catchers were getting all the credit for a pitch being called a strike or ball. All the credit to Ben, Scott Spratt, and Joe Rosales for that. They were a team on that and did most of the work.
The umpire is key in determining whether a pitch is a ball or strike. Some umpires have tendencies that other’s don’t. Giving the catcher credit for an umpire who tends to call balls out of the strike zone is not appropriate.
Mark: What were the biggest surprises you found in the early days of Defensive Runs Saved?
John: The big one was comparing Jeter vs Everett, an article from the first Fielding Bible book. That article established what the heck was going on (and showed that Adam Everett was a great fielder and Jeter was not as good as his reputation).
People really got to understand that the analytics have value and Bill’s research made such a big difference. It gave it credibility. Looking through in the kind of detail he did was fantastic. It was a stepping stone into acceptance of this kind of information.
Mark: Do you remember what the public reaction was?
John: There were a lot of people who had some doubts in the data, they started nodding their head yes. That this is really showing what’s going on.
What it doesn’t always measure is the intelligence of Jeter’s play. He did a lot of good things on the field that aren’t measured, but in terms of his basic job, he was not one of the best. He was definitely below average at getting to balls that other shortstops would get.
Mark: Can you tell the story of Ozzie Guillen’s reaction to our defensive stats?
John: Pat Quinn and I were the reps visiting with the White Sox every year.
We were meeting with their analytics team in a cafeteria that was pretty empty. It was right before a game that got called because of rain.
Ozzie—then the manager—and the players come into the cafeteria. Ozzie happens to sit at the table next to us. He starts listening and I’m explaining the whole system. He starts looking at our stuff.
“Show me that (expletive) thing … Oh my gosh. This (expletive). If they had this (expletive) when I was playing, I would’ve been the greatest (expletive) shortstop that ever (expletive) lived.”
Every other word was the f-word. But he believed the numbers and gave us credibility instantaneously. It wasn’t ‘This stuff is (expletive).’ He was giving it credibility.
For more information about Defensive Runs Saved, check out FieldingBible.com