We are now over halfway through the 2023 College Football season and coming closer to a 2024 that will look nothing like its predecessor. A new playoff format and new conference alignment will take center stage and drive the new era of college football forward.
We decided to take a stab at realigning FBS college conferences based on a multitude of features that can be grouped by academics, location, on-field football performance, and finances. If we blew up the whole existing scheme and went for schools that were most aligned on these key factors, how would that shake out?
For the mathy people out there, these factors were weighted using Multiple Factor Analysis and then used to create new conferences utilizing K-Means Clustering. Some additional details about the methodology are included below.
Without further ado, let’s jump right into the fun!
Features
As stated previously, the features can fall into 4 categories: academics, location, on-field football performance, and finances.
Academics
- R1 University Status – A university that has high research activity with the required benchmarks outlined here. As it stands, only 3 schools in the current Power 5 do not have R1 status.
Location
- The latitude and longitude of each college football stadium for the respective school.
On-Field Performance
- Winning Percentage – The winning percentage of each team from 2018-2022.
- Average Recruiting Ranking – The average 247 star-ranking for each player on the team from 2018-2022.
Finances
- Total Athletic Department Revenue – All sources of operating revenue for the schools’ athletics departments for the 2022-2023 fiscal year.
- Total Athletic Department Expenses – All operating expenses for the schools’ athletic departments for the 2022-2023 fiscal year.
- College Football Head Coach Salaries – The total pay by the school and athletically related compensation from non-university sources in 2023.
*The data collected comes from USA Today. Private schools are exempt from reporting revenue, expenses, and coaches’ pay as well as some that are under state exemption. To fill in the missing data, the average dollar amount from the respective school’s current conference was used. The proxy values for Army and Navy come from the AAC, and Notre Dame’s are averages of the top 20 schools in each category.
Methodology – Tailored Version
Here’s the skinny on what we did.
We started by structuring the various inputs into groups and then trying to identify where those inputs could be consolidated, so our model becomes as streamlined as possible.
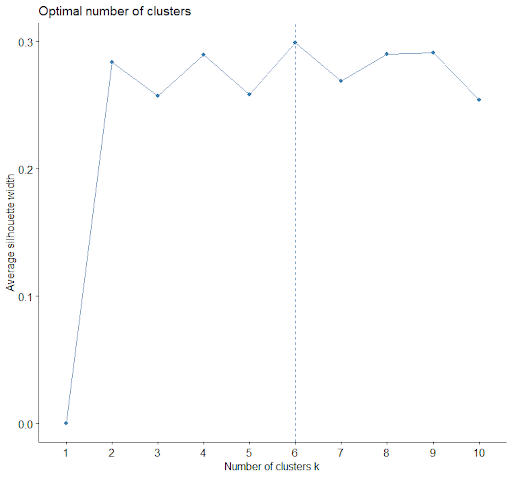
From there, we took those component measures for each school and grouped them by similarity. We can use statistical methods to identify how many groups (“clusters”) there should be, which said that about 6 conferences makes the most sense.
Yes, that means we’re coming out with a lot fewer conferences than currently exist in FBS. But we’re having fun here (and boy are those new conferences going to have some fun).
Methodology – Detailed Version
Multiple Factor Analysis
Multiple factor analysis is used to structure the provided data into groups and then reduce dimensionality using a combination of principal component analysis and multiple correspondence analysis. More on the specifics of multiple factor analysis can be found here.
In regards to this analysis, each of the quantitative variables are scaled to a z-score and then weighted properly in each component. In this case, 5 components (dimensions) were selected to be used for clustering with 97.48% of variance explained. The following is a table of the contributions of each group of variables to each dimension:
| Dimension 1 | Dimension 2 | Dimension 3 | Dimension 4 | Dimension 5 | |
| Academic | 25% | 3% | <1% | 46% | 25% |
| Performance | 33% | 1% | 2% | 47% | 53% |
| Financial | 42% | <1% | <1% | 1% | 21% |
| Location | <1% | 95% | 97% | 5% | 1% |
K-Means Clustering
K-Means clustering is an unsupervised machine learning technique used to create clusters of data with similar traits. Basically, the optimal number of clusters is selected by the analyst with help from some optimization techniques, and then the model optimizes how to assign each data point to its ideal cluster center. Once the clusters have been made and each data point has been assigned to a cluster, it is up to us on how to interpret those clusters distinctly. Read here for more on K-means clustering.
In this case, each cluster includes the teams that will be in each new proposed conference. Based on the results, the optimal number of conferences will be 6. Additionally, the worst option other than 1 is 10, which will be the number of conferences after the PAC-12 disbands next season. This number was determined using the best silhouette distance (see here) for the given number of clusters. The plot visualizing this can be seen below.

Results
Step aside Power 5, I present to you the Sweet 6 FBS Football Conferences!
Southern USA
| Baylor | FIU | Florida Atlantic | Georgia State | Georgia Tech |
| Houston | Louisiana | Memphis | Mississippi State | New Mexico |
| North Texas | Rice | South Florida | Southern Mississippi | Texas Tech |
| Tulane | UAB | UCF | UTEP | UTSA |
In the newly formed Southern USA conference (named in part because we see a lot of current C-USA schools), we see a mix of teams that come from both the original power and non-power 5 conferences. All of these schools are R1 universities. The range of recruiting rankings goes from 2.4 to 3.23 and only 4 schools have athletic revenue and expenses over $100 million (Baylor, Georgia Tech, Texas Tech, and Mississippi State).
PAC-17 (RIP 2-Pac)
| Arizona | Arizona State | California | Colorado | Colorado State | Hawaii |
| Nevada | Oregon | Oregon State | Stanford | UCLA | UNLV |
| USC | Utah | Utah State | Washington | Washington State |
The new look PAC-12 adds Colorado State, Hawaii, UNLV, Nevada, and Utah State in this scenario. The geographical impact of this conference is prevalent with all of these schools located in Colorado or west. USC, Oregon, Washington, and UCLA are still in this conference based on the factors considered and were unable to make the jump to the elite conference that we will discuss later. However, the first 3 lead the new conference in recruiting rankings with an average of 3.51, with UCLA in 7th at 3.10.
The American 30
| Air Force | Akron | App. State | Arkansas State | Army | Ball State | Boise State | Bowling Green |
| BYU | Central Michigan | Charlotte | Coastal Carolina | East Carolina | Eastern Michigan | Fresno State | Georgia Southern |
| Jacksonville State | James Madison | Liberty | Louisiana Tech | Louisiana-Monroe | Marshall | Miami OH | Middle Tennessee State |
| New Mexico State | Northern Illinois | Sam Houston State | San Diego State | San Jose State | SMU | South Alabama | TCU |
| Texas State | Toledo | Troy | Tulsa | Wake Forest | Western Kentucky | Western Michigan | Wyoming |
This conference is really the best of the rest across the country. This is the only conference that includes teams that are not R1, as all of these institutions do not have that distinction. Wake Forest, BYU, and TCU are the current Power 5 schools that find themselves in this conference. This conference spans the entire United States, highlighted by a would-be conference game between Army and San Diego State, schools that are 2,796 miles apart. Hopefully the MAC teams in this conference wouldn’t push for the Wednesday night games or these two schools would be doomed!
The Northleast
| Buffalo | Kent State | Navy | Ohio |
| Old Dominion | Temple | UCONN | UMASS |
These 8 teams are the bottom-tier when it comes to winning percentage and recruiting rankings. 7 out of 10 fall in the bottom 30 in recruiting and 5 out of 8 fall in the bottom 30 in winning percentage. One of the main reasons why they are separated from The American 30 is that they are all R1 institutions. It is a shame that basketball performance is not taken into account for the Huskies, as the reigning national champion and perennial powerhouse basketball program would certainly lift this team to a better conference.
TCGP (The Champion Gets Promoted)
| Kansas | Rutgers | Vanderbilt | Nebraska |
| Arkansas | Northwestern | Illinois | Indiana |
| Duke | Louisville | Maryland | Virginia Tech |
| Syracuse | South Carolina | Boston College | Purdue |
| North Carolina | Missouri | West Virginia | Virginia |
| Ole Miss | Michigan State | Iowa State | Kansas State |
| NC State | Pittsburgh | Wisconsin | Kentucky |
| Oklahoma State | Minnesota | Iowa | Cincinnati |
The best of the rest in the Power 5 find themselves here one step below the elites. The current Big 10, Big 12, ACC, and SEC are all represented here as the mid-tier teams of their respective conferences. They are all R1 universities and have revenues over $100 million except for Cincinnati, who was just in the College Football Playoff 2 years ago and has the highest winning percentage of these teams. Kansas and Syracuse are the only two teams that don’t reach the 3-star recruiting ranking threshold in this conference. If relegation was alive in college football, this would be the conference where teams can make the jump to elite status or fall back down to.
The Premier 16
| Alabama | Auburn | Clemson | Florida |
| Florida State | Georgia | LSU | Miami FL |
| Michigan | Notre Dame | Ohio State | Oklahoma |
| Penn State | Tennessee | Texas | Texas A&M |
We have finally reached the elite tier conference. This conference boasts the best of the best including all of the national champions of this millennium. These teams recruit the best players, generate the most revenue, win the most, and are all R1 institutions. The SEC, Big 10, ACC, and Big 12 are all represented here as well as independent Notre Dame. All 16 of these teams reside in the top 18 when it comes to recruiting as well, meaning it might be difficult to keep any of these teams out of the Premier competition for long.
At the end of the day, this was a thought-exercise used to create new conferences based on a multitude of factors rather than location. At the end of the day, the west coast is still really far away, but dropping the FBS to 6 conferences really made similarities amongst teams that we wouldn’t usually compare stand out. Now let your minds wander on what relegation can look like year to year…


