We’ve reached prediction season for the NFL. A big part of dissecting the upcoming season is analyzing the schedule and predicting which teams will overperform or underperform their expectations.
Expectations these days come from the sportsbooks, especially through win totals. These markets have been posted and bettors have begun forming their stance on each individual team. The lines will move all offseason long, as more information and opinions will move the lines in one direction or another.
At SIS, we have created a pre-game prediction model to predict the spreads, totals, team totals, and moneylines of each game using a multitude of data points that we collect. We also constructed the model to be able to run for the entire season, allowing us to run simulations on the season and create win total prices of our own. The model went 18-13-1 in over-under predictions on team’s preseason win totals last season.
We have run our first simulation of the year and the Football R&D team selected their favorite wagering opportunities in the win total markets based on the model’s output. The three of us (Alex Vigderman, Bryce Rossler, and James Weaver) each selected four hypothetical wagers we would make in a snake draft style on the Off the Charts Football Podcast.
These are our model’s win total projections.
| Team | DraftKings Win Total | Model Projected Win Totals | Difference |
| Raiders | 6.5 | 10.4 | Over 3.9 |
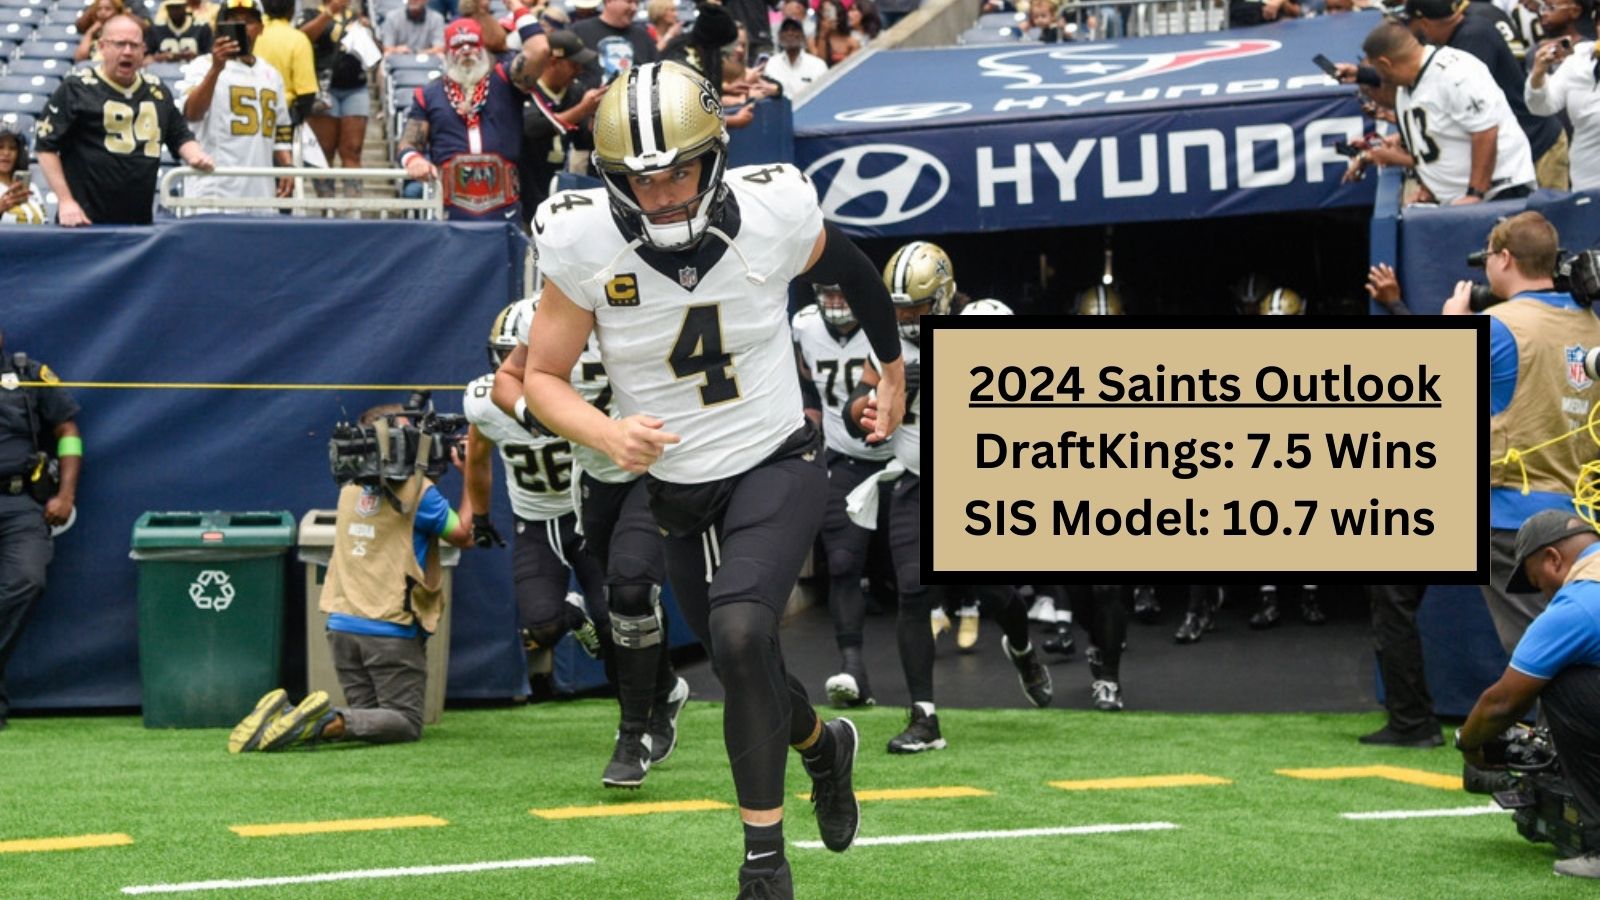
| Saints | 7.5 | 10.7 | 3.2 |
| Bears | 8.5 | 10.7 | 2.2 |
| Lions | 10.5 | 12.3 | 1.8 |
| Buccaneers | 8.5 | 10.3 | 1.8 |
| Browns | 8.5 | 9.8 | 1.3 |
| Packers | 9.5 | 10.7 | 1.2 |
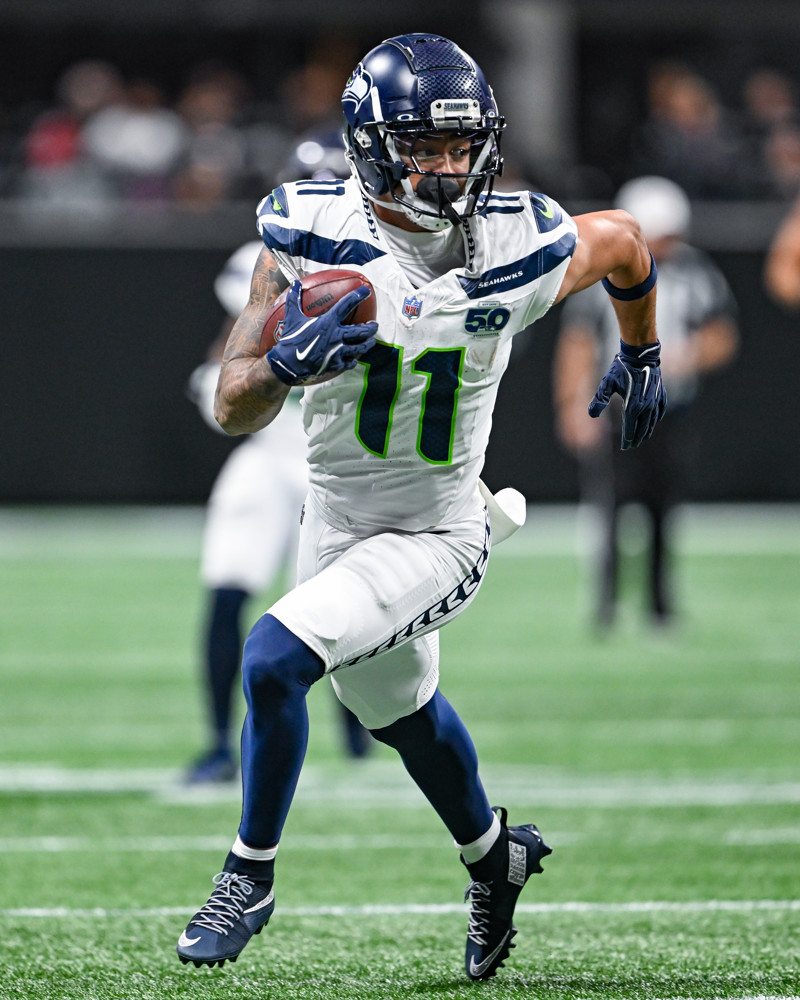
| Seahawks | 7.5 | 8.7 | 1.2 |
| Jets | 9.5 | 10.6 | 1.1 |
| Patriots | 4.5 | 5.5 | 1 |
| Ravens | 11.5 | 12.1 | 0.6 |
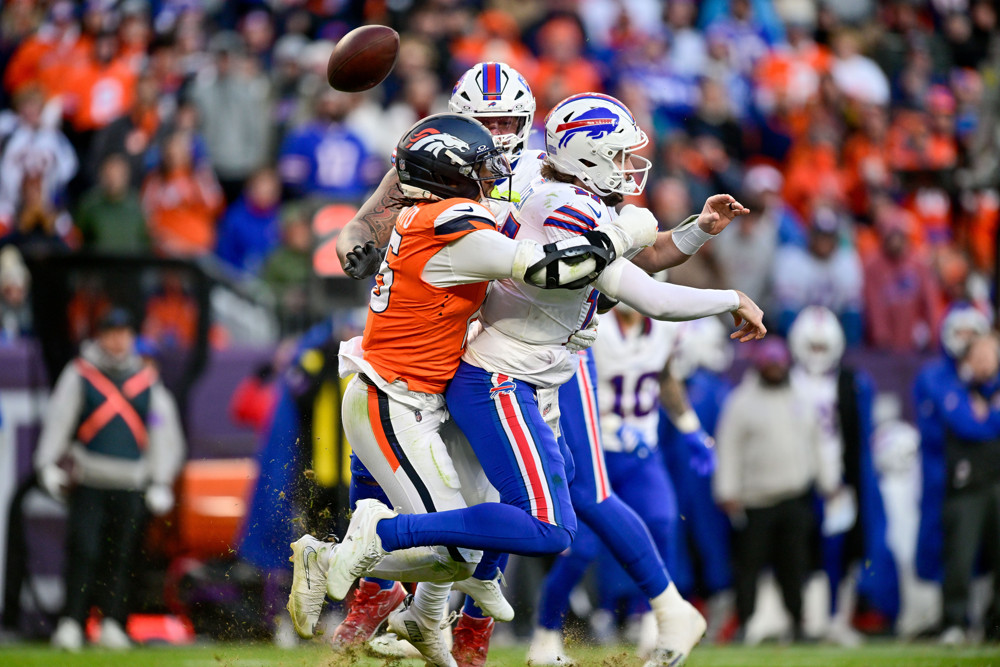
| Bills | 10.5 | 11.1 | 0.6 |
| Giants | 6.5 | 7.1 | 0.6 |
| Cowboys | 10.5 | 11.1 | 0.6 |
| Rams | 8.5 | 9 | 0.5 |
| Cardinals | 6.5 | 6.9 | 0.4 |
| Bengals | 10.5 | 10.9 | 0.4 |
| Texans | 9.5 | 9.4 | Under -0.1 |
| Panthers | 5.5 | 5.2 | -0.3 |
| Dolphins | 9.5 | 9 | -0.5 |
| Chiefs | 11.5 | 10.9 | -0.6 |
| Broncos | 5.5 | 4.7 | -0.8 |
| Steelers | 8.5 | 7.4 | -1.1 |
| Jaguars | 8.5 | 7.4 | -1.1 |
| Falcons | 9.5 | 8.1 | -1.4 |
| Chargers | 8.5 | 6.9 | -1.6 |
| 49ers | 11.5 | 9.8 | -1.7 |
| Colts | 8.5 | 6.1 | -2.4 |
| Vikings | 6.5 | 4 | -2.5 |
| Titans | 6.5 | 4 | -2.5 |
| Commanders | 6.5 | 3.2 | -3.3 |
| Eagles | 10.5 | 6.8 | -3.7 |
Model Overview (How did we get these numbers?)
Our model utilizes 18 features that are a combination of game, team, and player level metrics.
Game level metrics include whether or not the game is in the postseason, weather predictions like wind speed and precipitation probability, and a home team indicator.
Some of the team level metrics include weighted points for and points against averages, both offensive and defensive weighted penalty yards, and some possession metrics in the form of snaps per game or drive. Each of these metrics is computed for the team’s past 7 games, with the most recent weighted more heavily.
We use a weighted 16-game average with our Total Points for the player metrics. We calculate the average Total Points for each skill (Passer, Rusher, Pass Rush, etc.) for every player per snap, and then aggregate the projected values for each game to the team level using each player’s projected snap counts for the game.
Then, we utilize Monte Carlo simulation to illustrate variance in player performance by simulating 1,000 games for each player. After each simulation, all of the metrics are incorporated into a Lasso regression model to predict the team’s point total. The distributions of the predictions are aggregated to an average and spread so that point estimates and alternate point estimates can be drawn from the distribution.
Now that there are lines for each game, we can simulate 1,000 regular seasons based on the moneyline output and take the average win total for each team.
Analyzing the Overs
The Off The Charts podcast crew of Bryce Rossler, Alex Vigderman and I went through the over-under possibilities here and drafted the ones they felt best about (Listen to the episode here).
They went with the Raiders, Saints, Browns, Packers, Patriots and Cardinals on the ‘over’ side (listen to the episode to find out who took whom and their reasoning).
The model picked the Raiders and Saints to go over their Vegas win total by the widest margin. The Raiders are projected to have 10.4 wins and the Saints 10.7, good for 3.9 and 3.2 wins of value, respectively.
Both teams finished last season strong in regards to the various model inputs. The Saints are No. 1 in our Points For weighted average and No. 5 in Points Against weighted average, which goes back to the last 7 games played of last season. Additionally, Derek Carr ranks 2nd in the Passer Points per play weighted average coming into this season (5th if you include projected snap count).
The Raiders added Gardner Minshew, who is 8th in Passer Points per play weighted average and will battle Aidan O’Connell for the starting QB spot. They also come into the season 9th and 6th in the Points For and Points Against weighted averages, respectively.
The Browns and Packers come in at 1.3 and 1.2 wins above their current win totals of 8.5 and 9.5. The Browns will welcome back Deshaun Watson after catching lightning in a bottle with Joe Flacco at the end of last season. The Packers also finished strong, pushing the 49ers to the brink in the divisional round and are ranked second in recency-weighted Points For.
Our crew drafted both the Patriots and Cardinals even though the model total only slightly exceeded the DraftKings number. The reason: quarterback optimism.
Unders
After a total collapse at the end of last season, the Eagles come in with the most value towards the under, as they are projected to win only 6.8 games compared to a win total of 10.5. They rank 26th and 30th in recent points for and points against.
Bryce took both the Eagles and the Vikings, who are projected for 4 wins in our model when DraftKings has the over-under set at 6.5. Bryce doesn’t have faith in J.J. McCarthy and believes it will take him more than a season to get to a good place.
“This is a player who doesn’t have a lot of reps at game speed,” Bryce said. “I know he started several years at Michigan but he’s not passing a lot in that offense. I think Year 1 in the NFL is going to be very rough. I know they feel like as an organization that they’ve found their quarterback. But I don’t see it in Year 1.”
The Vikings defense also ranked in the bottom eight in points against, with a bottom-five rank in defensive Total Points over the full season.
Two of the other unders taken in our “draft” were the Chargers, who have a 6.9 expected win value compared to their 8.5 wins total, and the 49ers, who have a 9.8 expected win value compared to a win total of 11.5.
The Chargers are in the midst of a small rebuild and culture change with a new coach, and our drafter, Alex, wants to see it to believe it with another new coaching staff and a reworked skill position group.
The 49ers, fresh off the Super Bowl loss, were in a few dogfights down the stretch in the playoffs, and the defense wasn’t as good as its reputation last year, hence the reasons for the differential.
“I look at their schedule … they get the AFC East, and they lump in the Chiefs,” James said on our podcast (that’s me!) “Improved NFC, Super Bowl hangover being real. I just think 11.5, that’s pretty high.”
A Battle in Charlotte
Two of our draftees, Alex and Bryce, will go head-to-head this season when it comes to the Carolina Panthers.
Bryce has taken the under 5.5 because he doesn’t see a scenario in which Bryce Young can be a good quarterback for this team.
Alex, on the other hand, thinks the hate has gone too far, and has a little more optimism with a new head coach in Dave Canales (who improved the quarterback play of Baker Mayfield and Geno Smith over the last few years).
“This is my pick in the genre of ‘Rookie quarterback might take them somewhere,’” Alex said. “I think you could also have ‘Rookie quarterback is anomalously bad’ and people get kind of insane about it. A year ago people were feeling reasonably good about the rest of the team, offensive line and defense. I do think there’s an overreaction and they can get a little bit of a bounceback.”
The model sides with Bryce by the slimmest of margins, projecting 5.2 wins to the win total of 5.5.
Check out the full Off the Charts Football Podcast here for more analysis!
Follow us on Twitter at @football_SIS and check out the DataHub and DataHub Pro for access to all our stats.