Photos: Allan Dranberg (Semien), Joe Robbins (Raleigh), Rich Graessle (Arraez), Leslie Plaza Johnson (Adell)/ Icon Sportswire
If you’ve watched baseball the last few years, you’ve inevitably seen the shot of a player pulling a card out of his back pocket, studying it, and then going back to his position.
The cards, customized at the major league level for each pitcher and each batter, identify how far and in which direction a fielder moves off a starting point that was likely designated before the first game of a series.
I’ve seen this for long enough now that I’m curious against which hitters the cards have been most successful.
At SIS, we actually have a way to identify that. The out probabilities we use in establishing a player’s Defensive Runs Saved include a value specific to positioning.
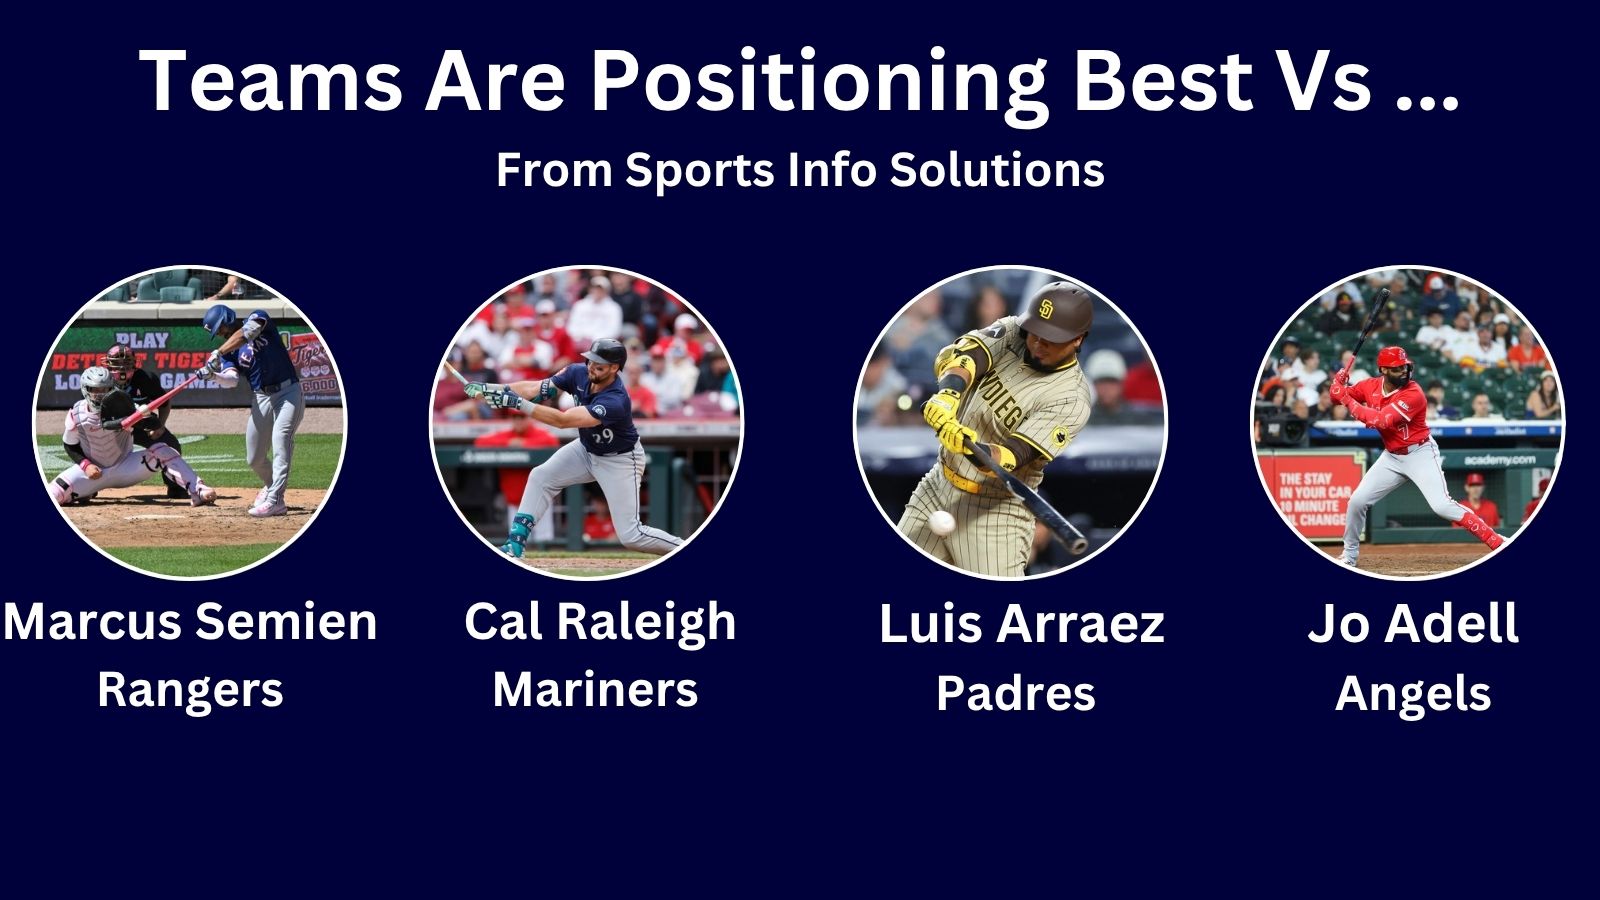
Here are the hitters against whom teams have gotten the most positioning Runs Saved per 100 balls in play from the start of last season through the end of May 2025.
| Player | Runs Saved Per 100 |
| Marcus Semien | 2.5 |
| Cal Raleigh | 2.5 |
| Luis Arraez | 2.4 |
| Jo Adell | 2.4 |
| Freddy Fermin | 2.2 |
| Matt Olson | 2.1 |
| Mark Vientos | 2.1 |
| Hunter Renfroe | 2.1 |
Simply put, the data we collect allows us to establish:
A) An overall out probability for a ball hit to a certain spot at a determined velocity without knowing where the fielder is positioned
B) An out probability for which we do know where the fielder is positioned.
The formula calculates the difference between A and B and converts it to a run value based on the characteristics of the batted ball. That value is credited to the defensive team rather than the player.
This happens whether or not the play is successfully completed, because positioning can be good even when a play is not made.
In other words, if we know a ground ball hit at X miles per hour to a designated spot Y is an out 50% of the time overall, but 70% of the time when the shortstop is positioned in location Z, then the team gets credit for improving the out probability by 20%, which is worth some fraction of a run.
To illustrate, here’s a play from earlier this week, Jerar Encarnacion’s game-ending 101-mile-per-hour line drive to perfectly-positioned Padres first baseman Luis Arraez.
The characteristics of this batted ball were such that it had a 59% probability of being an out without knowing where Arraez was positioned. But with Arraez where he was, the out probability was 100%. Arraez gets no Defensive Runs Saved credit for making the catch but the Padres get a credit for improving the out probability by 41 percentage points (from 59% to 100%).
I want to examine a few of the players from that leaderboard more in-depth to give you a sense of what we’re talking about here.
Marcus Semien
I’ve seen Marcus Semien pop up on a couple of “unluckiest hitter” lists the last couple of years as his numbers have collapsed since the start of 2024. But I think there’s something more to it than that.
Semien has played in almost every one of his team’s regular season games since 2018. That provides a lot of data from which to make educated guesses on where Semien is going to hit balls. For the last year-plus they’ve made good decisions.
Here’s a good-looking double play that the Giants turned on Semien in April. Our calculation is that Willy Adames’ positioning at shortstop increased the Giants’ out probability on this ball from 20% to 61%.
That’s a hefty credit that ends up worth about one-third of a run. There were only two other ground balls hit by Semien this season on which a team got more positioning Runs Saved than that. One of them was this one, after which Semien had to be wondering what the heck just happened. The Rays’ positioning improved the out probability by 75%!
But there was a good reason that play happened. The coaching staff knows that Semien hits 87% of ground balls and short line drives to the left of second base. Thus, their second baseman plays close to the base, which gives him a chance to make that play. Here’s a spray chart of his last 120 ground balls entering Wednesday.

These spray charts are rather rudimentary and just look at the hitter’s tendencies. Team charts are more sophisticated and factor in the pitcher (and sometimes the count) too. For ground balls and short line drives, we consider the last 120 hit. For balls hit to the outfield, we look at the last 135.
But in this case, the hitter’s tendencies give you a good look at what he’s going to do.
Those plays are admittedly at the higher end when it comes to team credit. Most plays aren’t like that. A more basic example of good positioning against Semien would be this fly ball struck pretty well to right center field but run down with ease by Brenton Doyle, who was playing 331 feet deep and a little bit to the right of second base. The positioning allowed him to make up for a slightly delayed jump. It upped the out probability of the play by 22%.
Semien had a career-worst .250 BABIP last season. He’s at .242 in 2025.
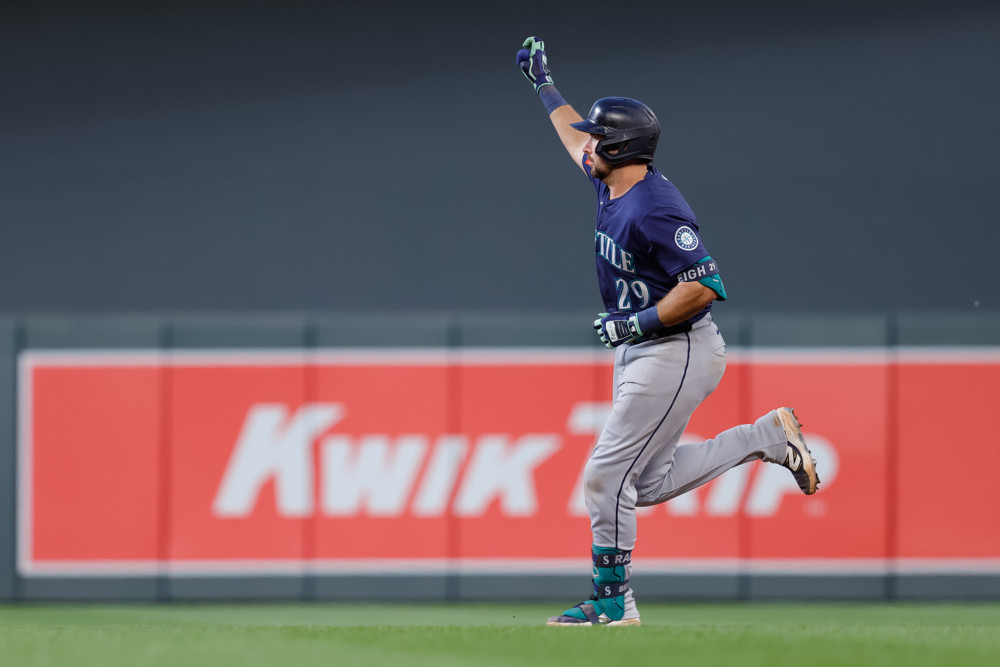
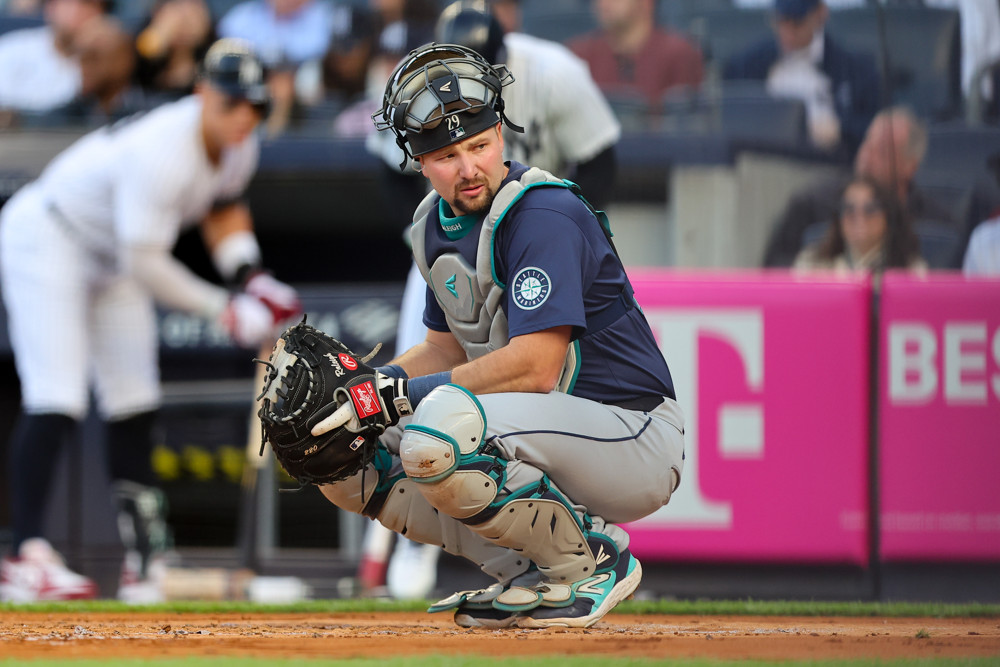
Cal Raleigh
Cal Raleigh is having an amazing season despite the fact that the cards are stacked against him (you had to figure that pun was coming, right?).
Here’s a play against the Blue Jays where they positioned their right fielder about as well as they could, so much so that he was able to get to the ball and throw Raleigh out at second base. Everyone wins at least a little bit here. Raleigh gets a hit. The right fielder gets an assist. And the Blue Jays get 47% (0.47 plays) credit for putting the right fielder in a good spot.
A look at Raleigh’s last 135 outfield flies and liners shows he hits the ball toward the right field line enough that defenses need to be ready for it.

Here’s another instance with Raleigh where the team gets a reward for positioning even when the player makes an error. The Giants got this one right. It’s not their fault that Tyler Fitzgerald didn’t field this ball.
It’s weird to say that teams are defending Raleigh well given the year that he’s having. But what we’re seeing is that Raleigh is getting more hits than he usually does (a .278 BABIP entering Thursday) and that’s attributable to fielder skill issues rather than positioning ones. Perhaps another subject for another time.
Luis Arraez
Just before a pitch, the Padres broadcast showed us how Pete Crow Armstrong was positioned well over towards left center field against Luis Arraez.
And here’s what happened.
Crow-Armstrong makes most catches without this kind of positioning help, but in this case, the Cubs got a 52% credit for upping the out probability of this ball from 19% to 71%.
Arraez’s spray chart is different from Raleigh’s. The Cubs want to give Crow-Armstrong a chance to get those balls in the left center gap so they play him accordingly, with Arraez’s tendencies helping to guide the decision.

And because turnabout is fair play, here’s an example of Giants first baseman Dominic Smith being placed just right for an Arraez line drive and doing to Arraez what Arraez did to them a few days ago.
The spray chart shows that Smith was in the right spot based on Arraez’s grounder/short liner tendencies. While he doesn’t hit more balls down the line than he does towards the hole, those balls often end up as doubles so you want to account for them a little bit more.

Arraez has a .279 BABIP on balls hit in the air this season (.016 on fly balls!) He’s never finished a year below .372.
Jo Adell
Here’s an example of everything coming together. The fielder makes a good play on a ground ball and is rewarded (as is the player who catches the throw). But that play almost surely doesn’t happen if the scouting report isn’t heeded.
Anthony Volpe’s positioning on Jo Adell changed the out probability by 25%, turning it from a 24% out probability to a 49% one – basically making this a 50-50 play for which Volpe was on the right side.
Adell’s grounder/short liner spray chart is such that the shortstop is going to cheat to the 5-6 hole a lot.

Some people may say that Adell’s issue is that he strikes out too much. But he’s also a very predictable hitter when he does make contact, especially on the ground. And he’s paying for it – he’s hitting less than .200 on ground balls over the last two seasons. MLB average is .245.
We’ll take a look at which hitters are good at beating what the card says for positioning sometime in the near future.


