Photo: Steven King/Icon Sportswire
You’ve heard of the game-saving defensive play, right?
How about game-saving defensive positioning?
Go back about a month to the bottom of the eighth inning at Busch Stadium in a matchup between the Cardinals and Tigers. The score was tied with two men on and two outs. Pedro Pagés hit a 107-MPH line drive to right center that looked like it could be a go-ahead hit. But center fielder Javier Báez sprinted over to make the running catch. The Tigers went ahead in the top of the ninth inning and won the game.
You can see that catch here.
But what you don’t see in watching the TV broadcast was how the Tigers put Báez in position to make the play. This image from MLB helps provide a better understanding. The filled in black dot shows where he was stationed prior to the pitch.

By our calculations, balls hit to that spot at that speed in the last two years have been caught 43% of the time. But that out probability jumps to 95% when we know where Baez was positioned.
This was one of several examples of how the Tigers outfield has been the best positioned in baseball this season. They lead the majors with 12 Outfield Positioning Runs Saved.
We explained this in a couple of recent articles and will reiterate it again here. Pre-2013, SIS awarded positioning Runs Saved credit to the player. That credit now goes to the team as with the advent of shifting and positioning cards, the team has more control over where its players play.
The data we collect allows us to establish:
A) An overall out probability for a ball hit to a certain spot at a determined velocity without knowing where the fielder is positioned
B) An out probability for which we do know where the fielder is positioned.
The formula calculates the difference between A and B and converts it to a run value based on the characteristics of the batted ball. That value is credited to the defensive team rather than the player.
This happens whether the play is successfully completed or not, because positioning can be good even when a play is not made.
In other words, if we know a fly ball hit at 107 miles per hour to a designated spot Y is an out 43% of the time overall, but 95% of the time when the outfielder is positioned in location Z, then the team gets credit for improving the out probability by 52%, which is worth some fraction of a run. That’s the example with which we led this article.
Most Runs Saved – Outfield Positioning
2025 Season
| Team | Runs Saved |
| Tigers | 12 |
| Guardians | 8 |
| Braves | 7 |
| Rays | 5 |
| White Sox | 5 |
The Tigers’ success isn’t new. They led the majors with 18 outfield positioning runs two years ago before slipping to 2 such Runs Saved last season. We should note too that this year’s results are not the product of high volume. Tigers outfielders have faced the 20th-most balls hit in the air.
Here are a couple other examples of plays from 2025 in which positioning resulted in a significant payoff for the Tigers.
This ball was tagged 108 MPH and Riley Greene’s positioning in left field upped the out probability from 45 to 93%. You can see why. He barely had to move from where he was playing.

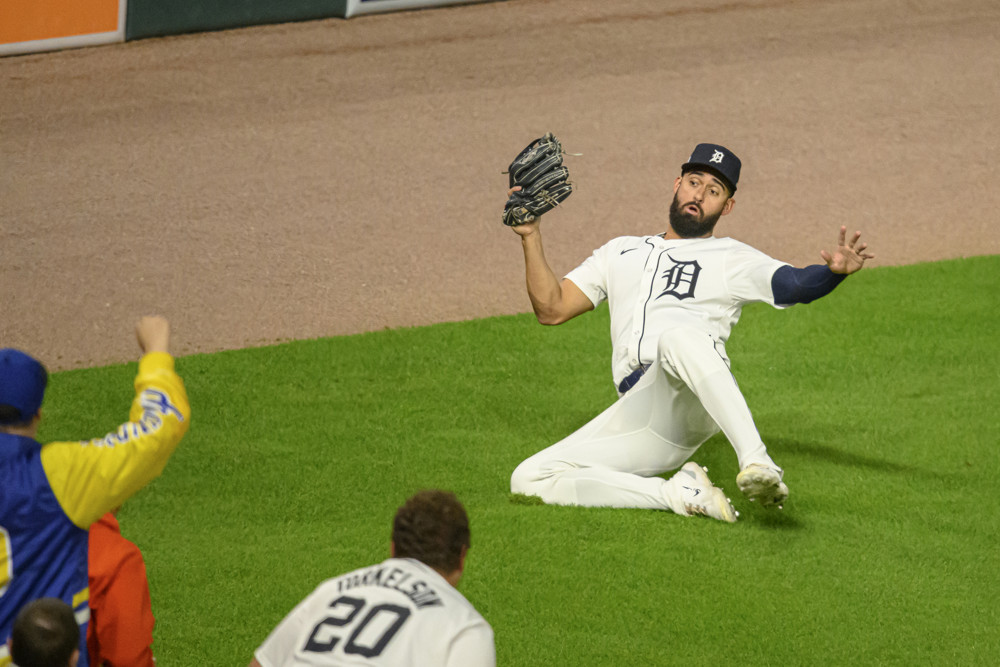
Sometimes positioning and playmaking go hand in hand. On this ball hit by Drew Waters of the Royals, right fielder Kerry Carpenter goes deep to make a tough catch.
Carpenter’s positioning upped the out probability of that play from 20% to 41%. Carpenter gets credit for the remaining 59% for making the catch that resulted in an out.

Though the positioning Runs Saved totals are relatively small, the numbers do matter. The Tigers rank 8th in Defensive Runs Saved overall.
They rank 19th in the skill components of Runs Saved but rank 1st in combined Runs Saved from infield and outfield positioning.
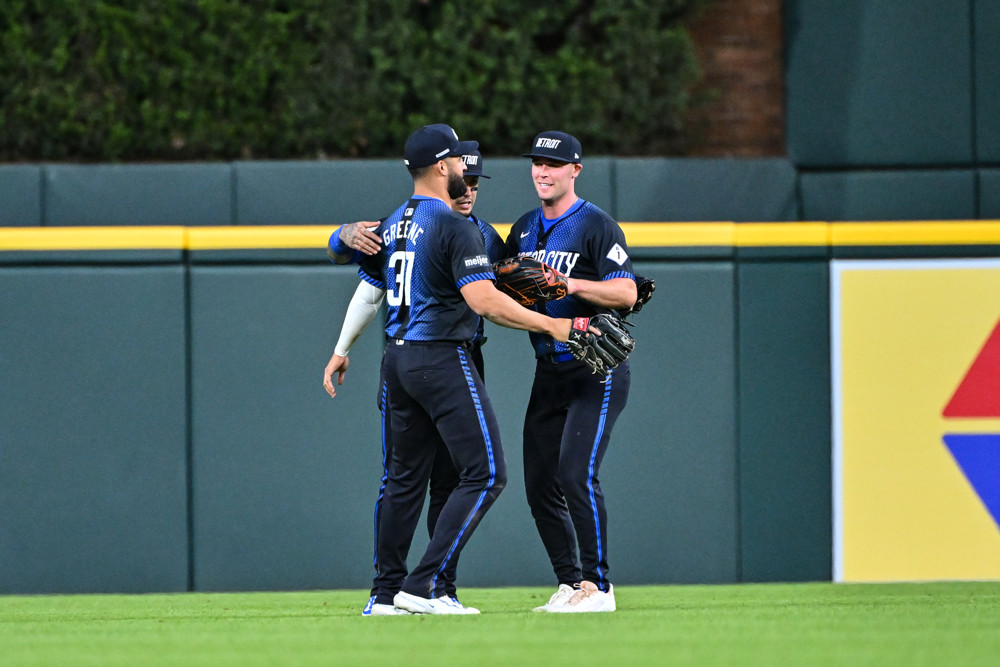
The team is in first place in the AL Central and its outfielders can rejoice as they did in the picture atop this article. Good positioning is the key to their defense.