Sports Info Solutions
Category: Baseball
-
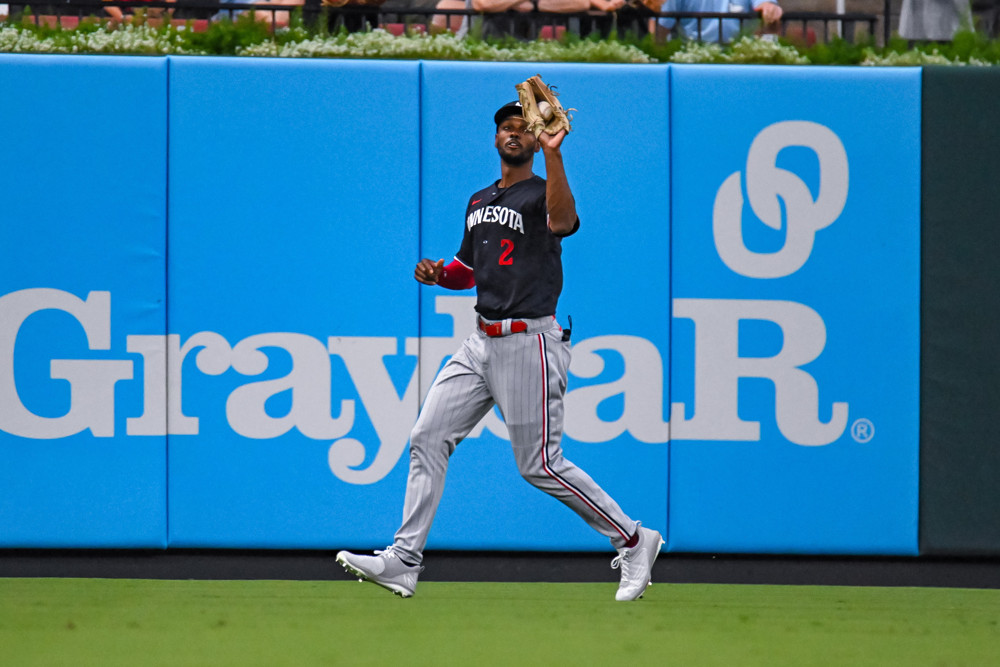
Michael A. Taylor, The Top Defensive CF The Last 3 Seasons, Still Has No Home
By
One of the best defensive players in MLB has slowed down a little but seems to still have something left
-
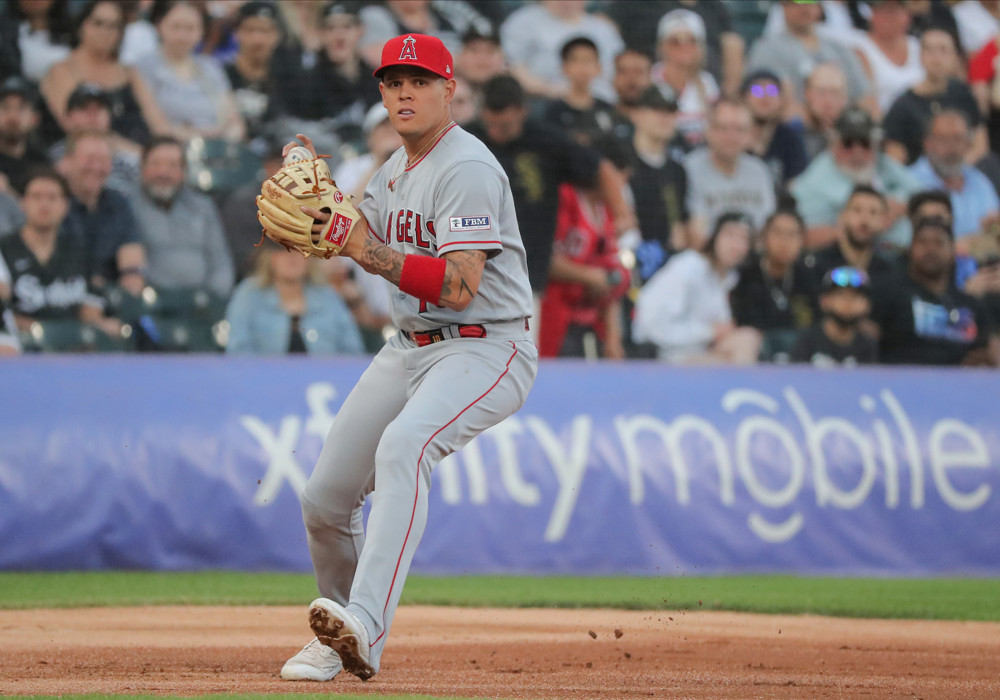
Stat of the Week: Gio Urshela Is A More Meaningful Signing Than You Think
By
The Tigers filled a big potential hole at third base.
-
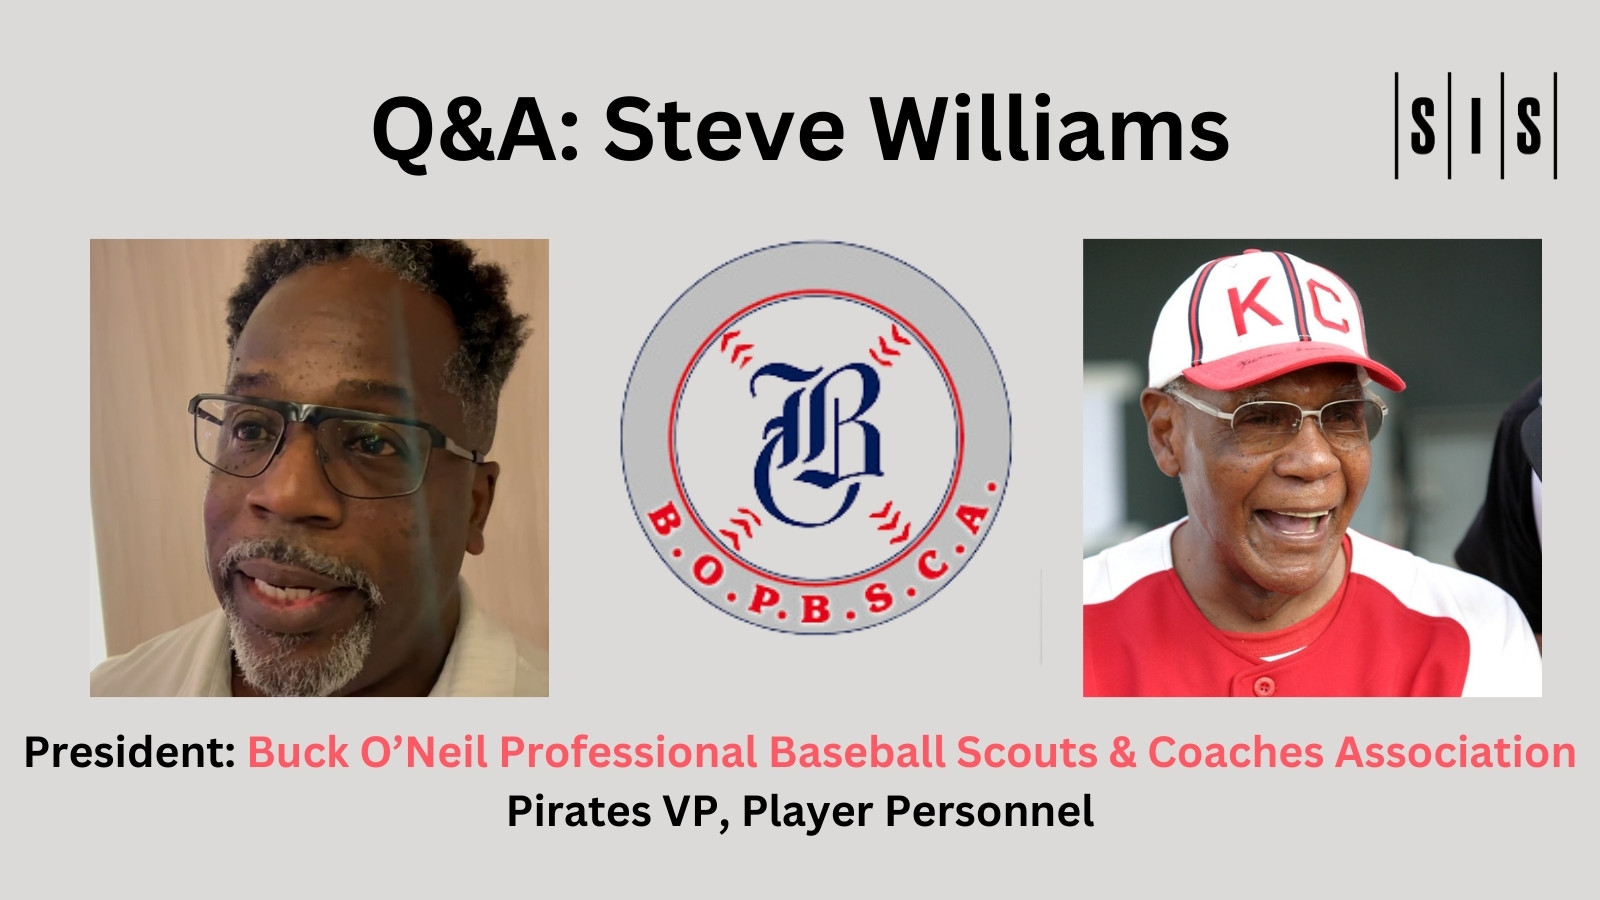
Q&A Steve Williams, Pirates VP and President, Buck O’Neil Professional Scouts & Coaches Association
By
Steve Williams shares his story, the story of The Buck O’Neil Professional Baseball Scouts & Coaches Association, and explains how scouts blend data and the eye test.
-
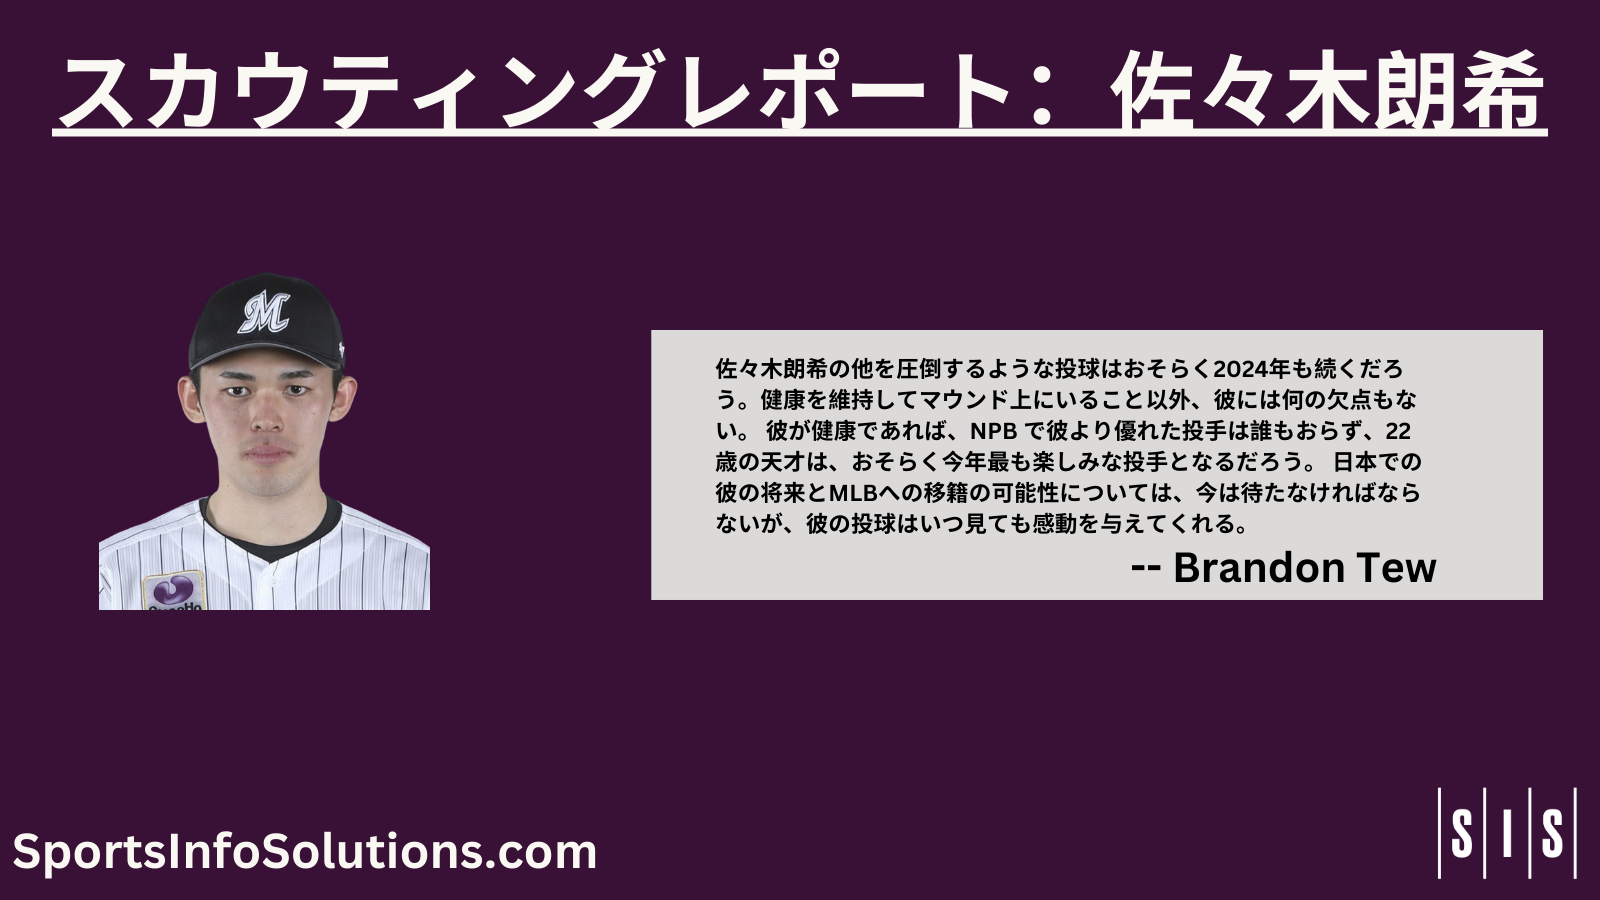
NPB スカウティングレポート:佐々木朗希
By
世界トップクラスのピッチャーの一人が、なるべく早くMLBでプレーすることを希望している。現時点で彼はどのようなピッチャーなのだろうか。弊誌のライター、ブランドン・テューは、すべての登板を観察し、評価を行った。
-
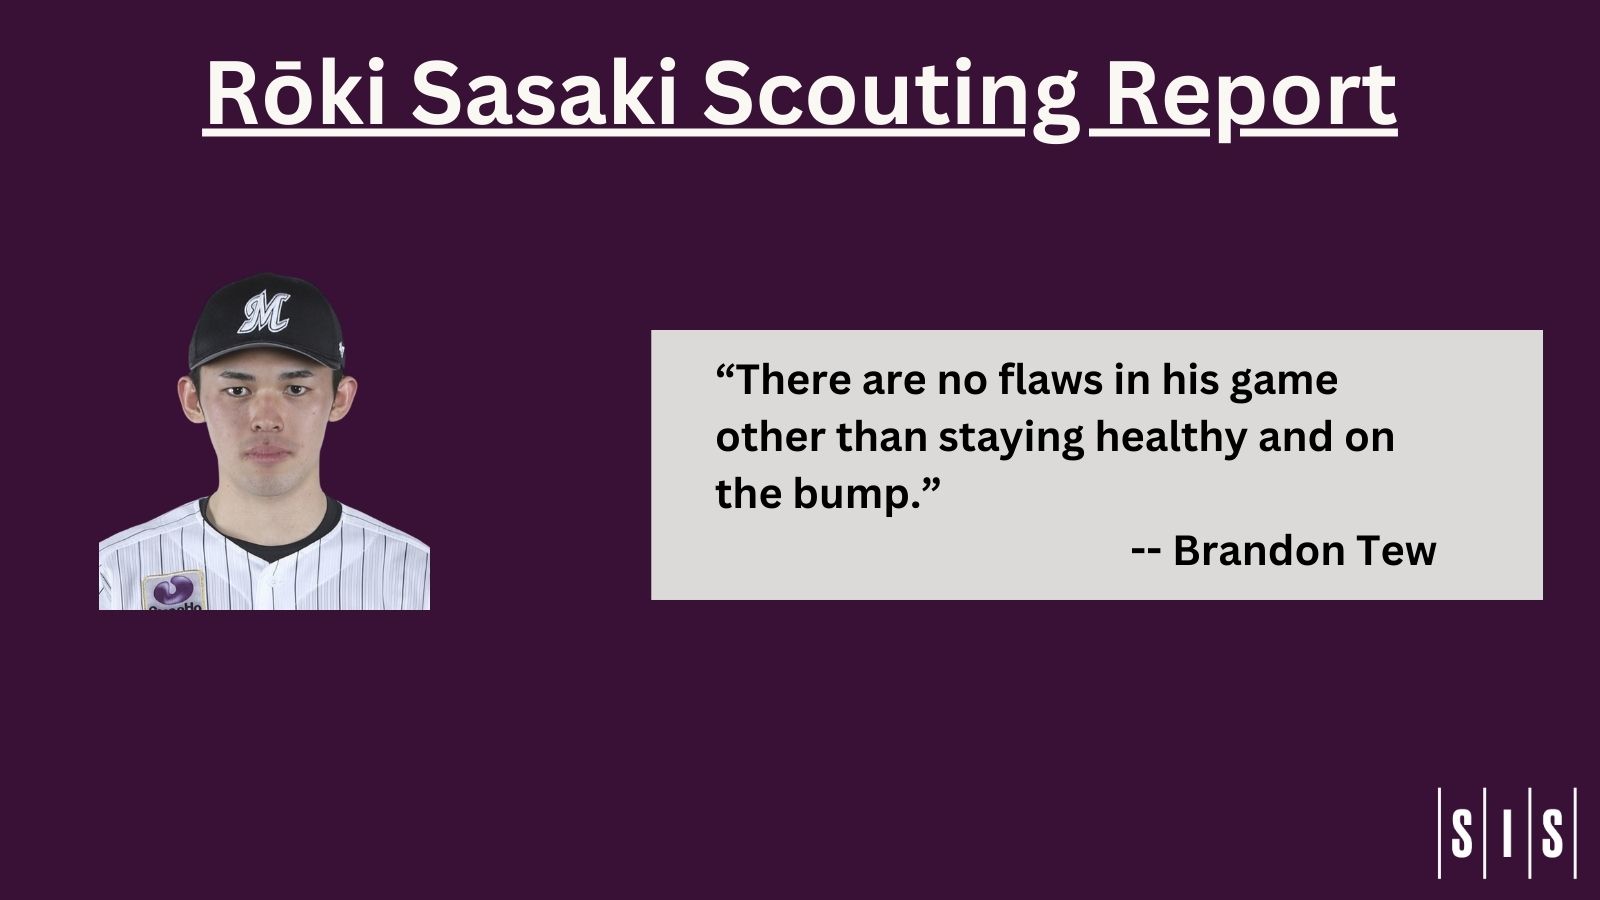
NPB Scouting Report: Rōki Sasaki
By
One of the best pitchers in the world has expressed a desire to pitch in MLB sooner rather than later. What kind of pitcher is he now? Our writer watched every start to make an evaluation.
-
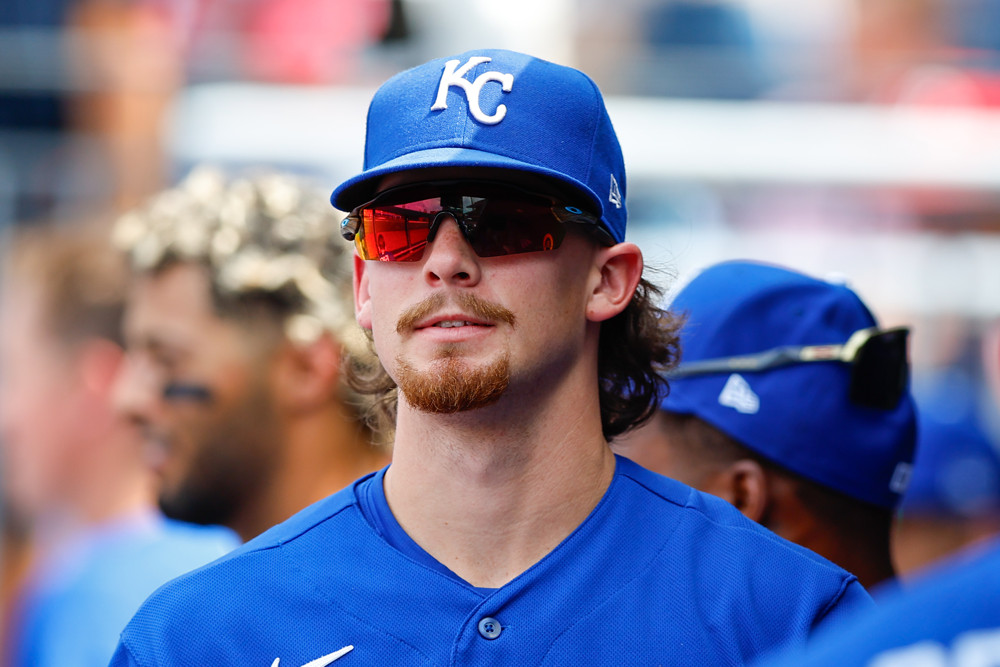
Imagining Bobby Witt As The Best Player in MLB in 2024
By
What would Witt look like as a hitter and fielder if he was an 8-10 WAR player instead of a 4-5 WAR player?
-

Stat of the Week: 2023’s Overperforming Pitchers
By
Matt Manning and Tyler Holton head the list of pitchers with the biggest difference between their expected OPS and actual OPS.
-
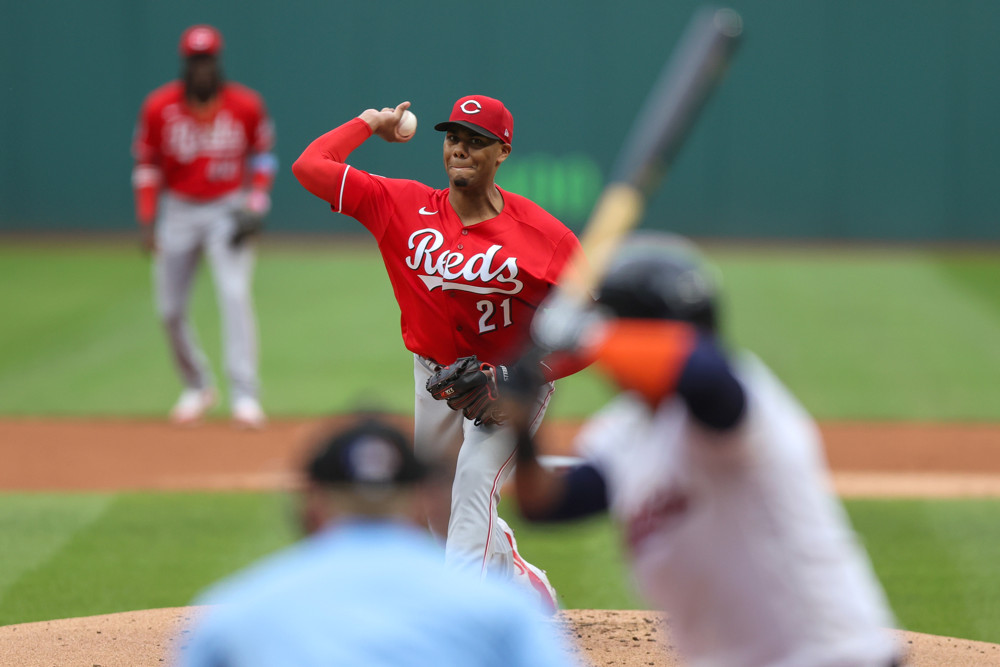
Stat of the Week: Hunter Greene Deserved Better in 2023
By
A look at Greene and other pitchers whose expected stats didn’t match up with their actual stats.
-
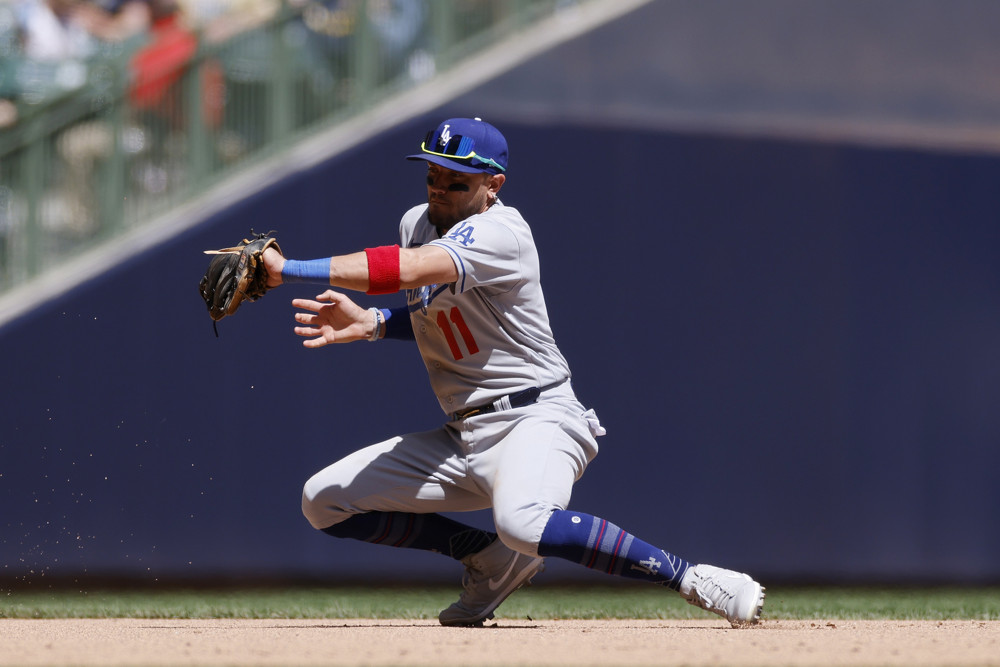
Miguel Rojas is the Best Defensive Shortstop in Baseball
By
Using stats from the last 3 seasons as our guide, Miguel Rojas is a clearcut choice. And yet, he may not even start regularly in 2024.
-
Q&A: Orioles pitching strategy coach Ryan Klimek
By
What does a pitching strategy coach do? One of our alumni explains.