Sports Info Solutions
Category: MLB
-
MLB Leaderboard: Who allows hard contact least often?
By
Stephen Strasburg tops the rankings in this stat. There will definitely be some surprises on this list.
-
MLB Leaderboard: Which teams hit the ball hard most often?
By
Taking a look at which offenses are crushing the ball consistently.
-
MLB Leaderboard: Who’s hitting it hard most often?
By
Cody Bellinger tops the list. One of his Dodgers teammates figures prominently as well.
-
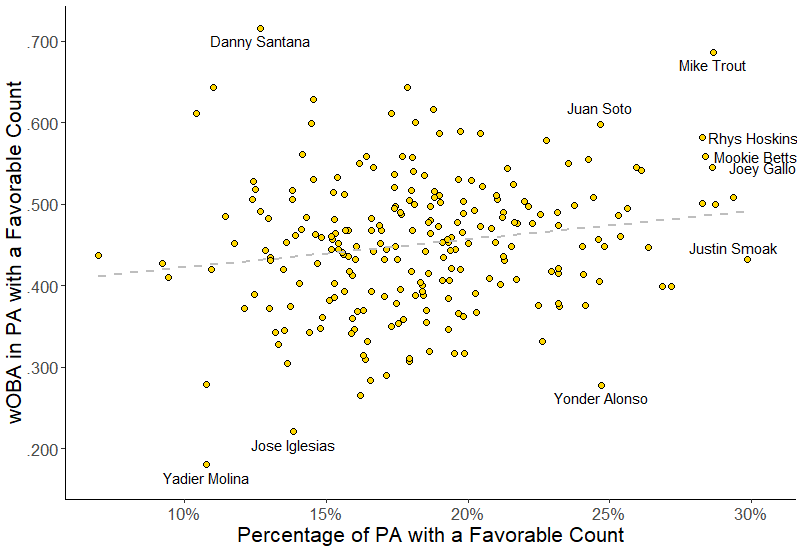
Which hitters reach favorable counts?
By
Which hitters get into favorable counts, like 2-0, 3-0, and 3-1? And which hitters then do damage?
-
What’s The Deal With Bryce Harper?
By
The $330 million man hasn’t quite lived up to expectations in his first season in Philly.
-
Which Teams Are Best at Drafting, Developing and Displaying DRS?
By
How has your favorite team fared at developing defense?
-

New baseball podcast episode: Mike Ferrin wants to be Byron Buxton
By
In this episode of the SIS Baseball Podcast (click here to listen), Mark Simon (@MarkASimonSays) begins by marveling at Zack Greinke’s defense (1:05). Mark then talks to MLB Radio and Arizona Diamondbacks broadcaster Mike Ferrin (@Mike_Ferrin). Mike makes his case for the best team in baseball (3:25) and discusses how much organizations value defense in…
-
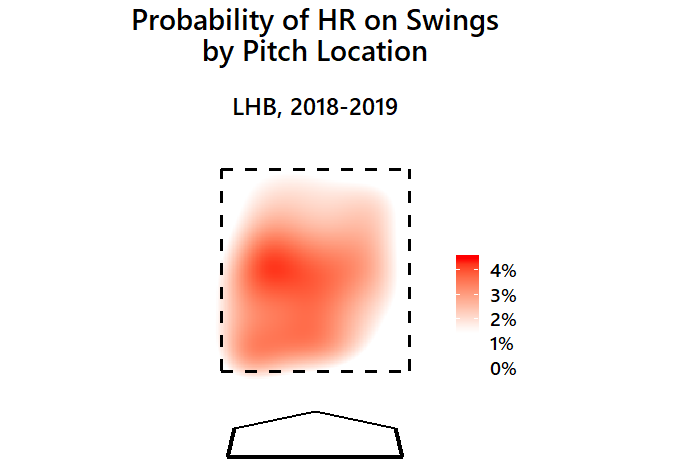
Visualizing Home Runs by Pitch Location
By
A look at which pitch locations generate home runs, and how it compares to several years ago when the home run wasn’t as common.
-
Ball off the Wall: Which outfielders make mistakes, which have not?
By
Who has the most misplays on playing balls off the wall? Who has made few or none?
-
Reintroducing FieldingBible.com
By
We’ve added lots of statistics to the FieldingBible.com website. Come check it out.