Sports Info Solutions
Tag: Kyler Murray
-

Patrick Mahomes Is Still The King Of Clutch (Despite the Bills Loss)
By
When combining our Total Points player-evaluation stat with a leverage index, Mahomes sits atop the list of clutch QBs
-

We’ve Seen This Before From Kliff Kingsbury
By
What has happened to Jayden Daniels resembles what previously happened to Kyler Murray.
-

Reviewing The 2019 NFL Draft Class
By
The Titans, Broncos, Raiders, and undrafted pickup Nik Needham had reasons to celebrate.
-
World’s No. 1 QB Rankings: Justin Herbert’s now No. 2!
By
We look at Herbert and the QBs who moved into the Top 10 during the regular season..
-
Joe Burrow’s Digging a Top-10 Ranking
By
The Bengals QB and Kyler Murray have had a nice upward movement on our World’s No. 1 QB list.
-
Who were the best QBs on long passes in 2020?
By
Leaderboards showing who threw the deep balls most, most accurately, the most for TD, and best
-
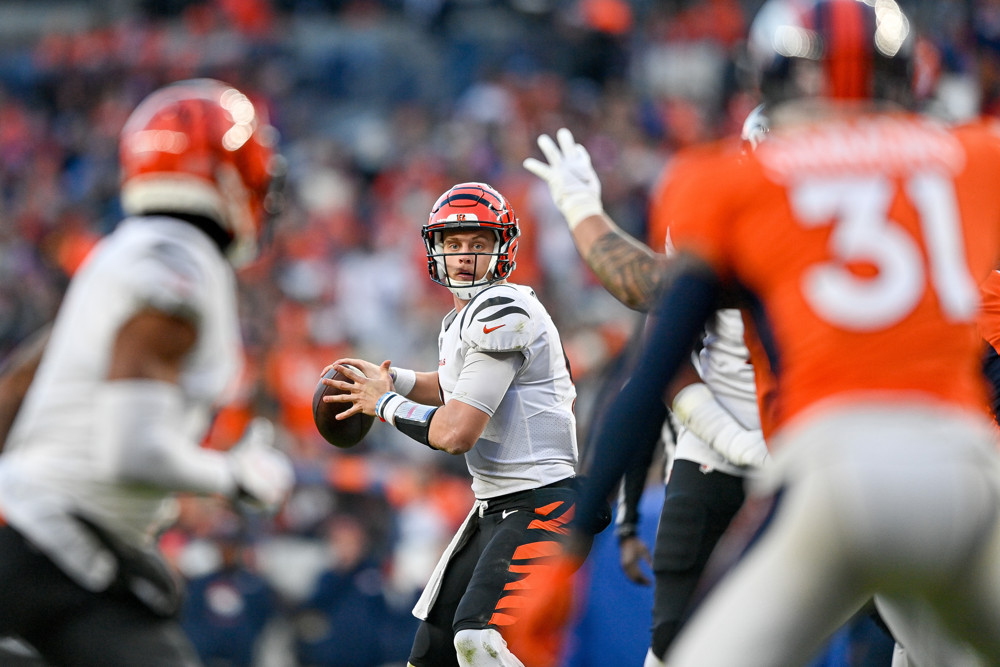
Lots of Stat-Based Reasons To Feel Good About Kyler Murray
By
When you dig into numbers like predicted completion percentage, Murray looks better than his results
-
Who were the best quarterbacks throwing long passes in 2019?
By
Is Russell Wilson as good as some say he is?
-
-