Sports Info Solutions
Author: Alex Vigderman
-
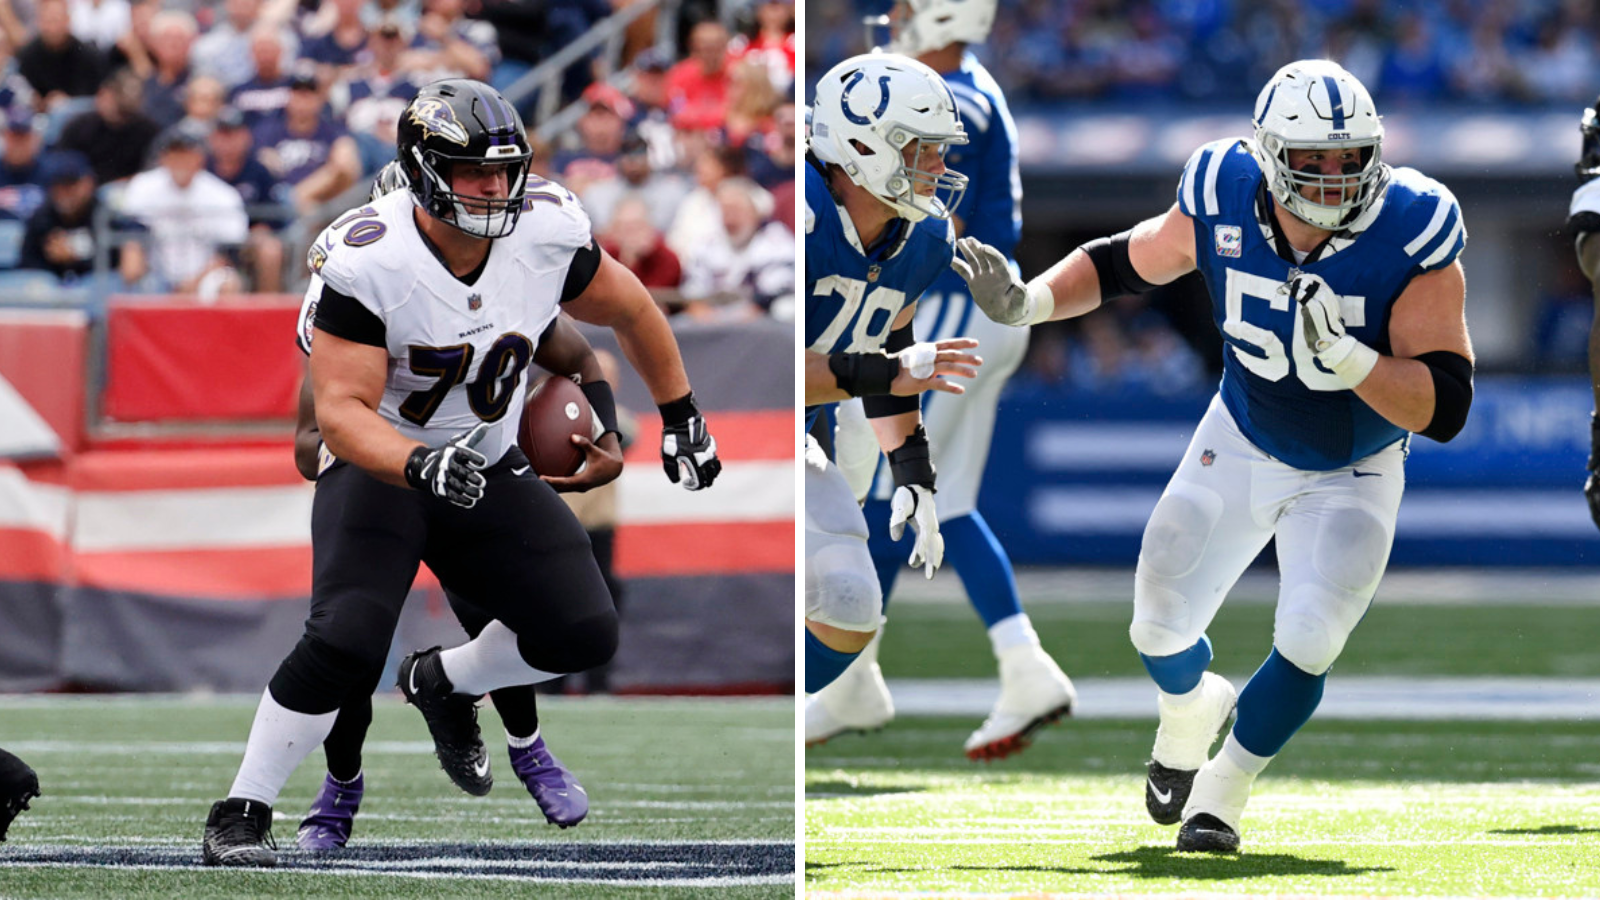
Scouts vs Stats: Top 10 Interior Offensive Linemen
By
Kevin Zeitler and Quenton Nelson each showed up near the top on one list, but not both. Check out how they and other offensive linemen fared.
-
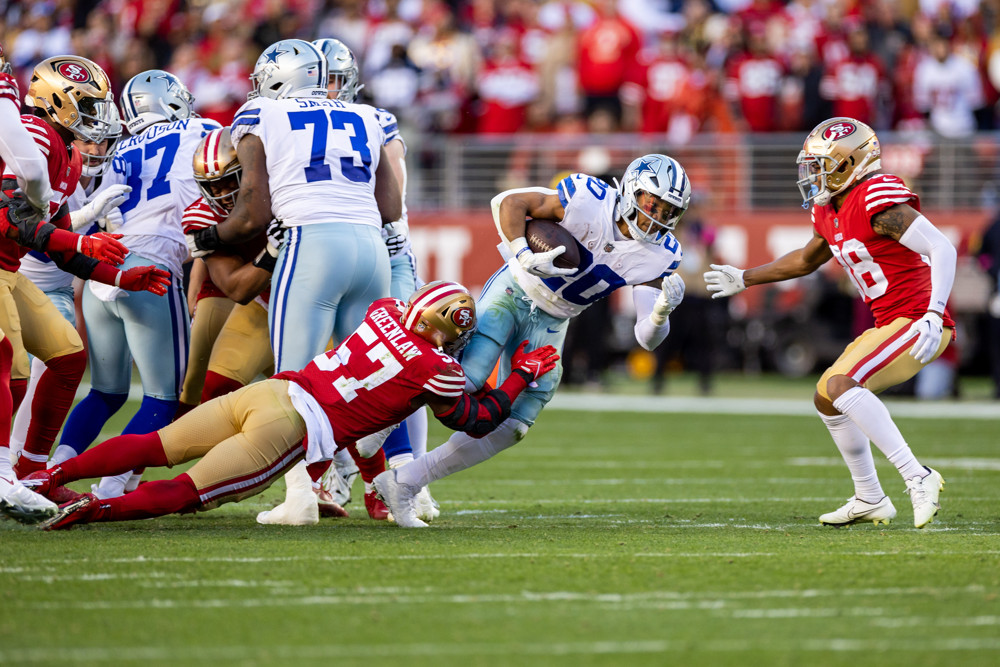
Scouts vs Stats: Top 10 NFL Running Backs
By
Tony Pollard made the Top 5 on one of our lists. Read to find out who else joined him and what other surprises were in store.
-
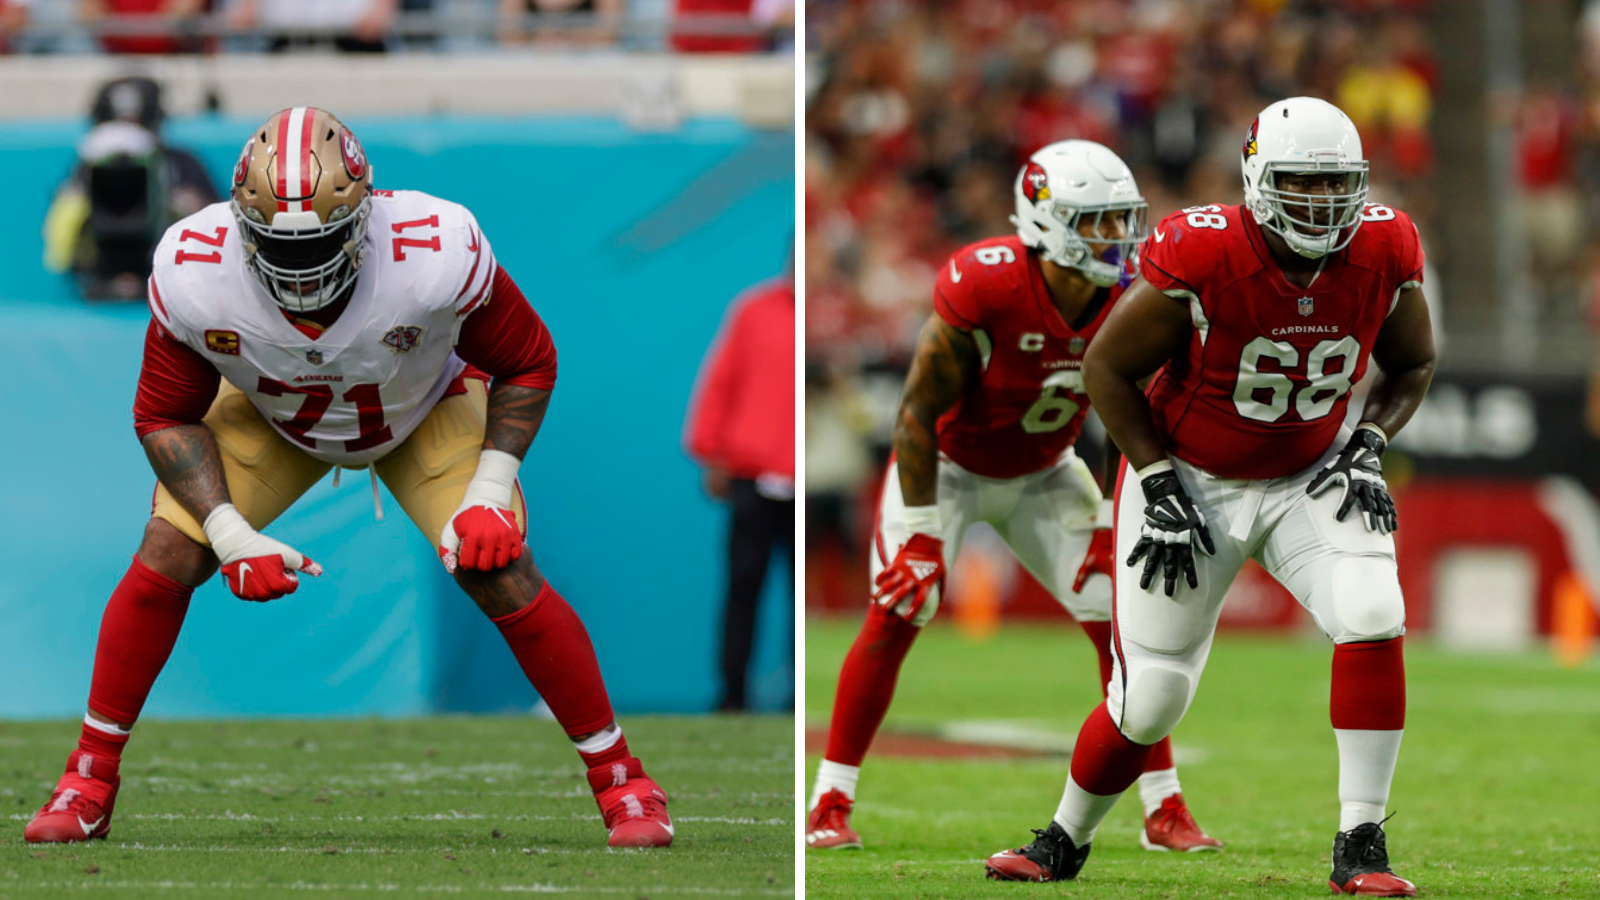
Scouts vs Stats: Debating The Top 10 NFL Offensive Tackles
By
Yes, ideally you want a blend of stats and scouts, but this makes for good discussion. The No. 1 on one list didn’t even make the other!
-
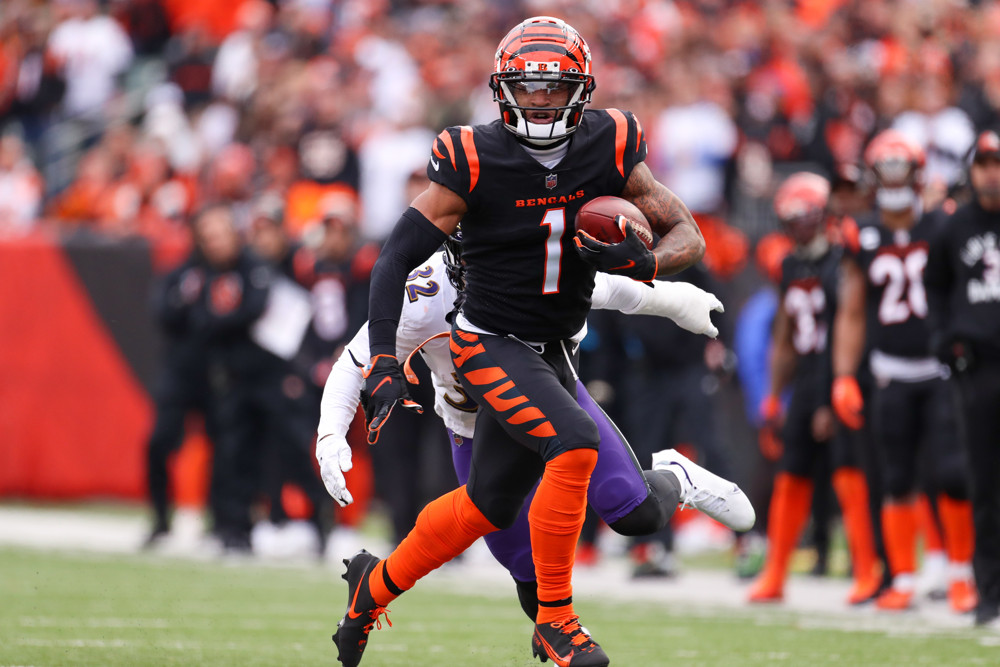
Scouts vs Stats: Debating The Top 10 NFL Receivers
By
Ja’Marr Chase landed at No. 3 on one list … but did he even make the cut on another?
-
SIS Announces Partnership with BetVictor to Supply CEBL Data and Odds
By
TORONTO, ON– May 23, 2023 – Sports Info Solutions (SIS) has announced a partnership with BetVictor to supply Canadian Elite Basketball League (CEBL) data and odds. Building upon the partnership established between SIS and the CEBL in 2022, SIS has developed new tools and capabilities for the CEBL, inclusive of data collection and data visualisations…
-
Reviewing 6 Studies and How They Apply To The 2023 NFL Draft
By
Combine measurements, route trees, trading for need, pick value, and a few other things we’ve looked into.
-
Which NFL teams Would Be Most Justified In Drafting For Need?
By
Some teams may be better suited for this than others. We came up with a system to identify and analyze some of the most intriguing fits to do this.
-

SIS Hires Sujoy Ganguly as Chief Data Scientist Amid its Advancement in the NBA Team Analytics Space
By
SIS, a leader in advanced sports data and analytics, has announced Sujoy Ganguly as its new Chief Data Scientist.
-
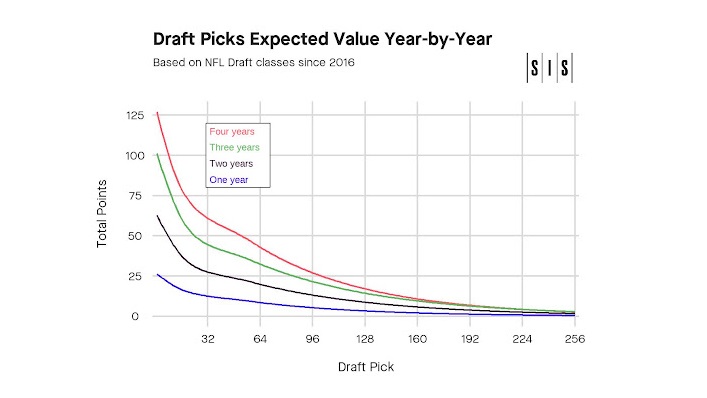
Revisiting Our Draft Pick Value Curve
By
Last year we created a curve that represents player value by draft pick. We expand on that research to look at future picks & value over a full contract
-
The Top Ranked NFL Draft Prospect At Every Position
By
We go across the field to bring you the SIS scouting staff’s top picks