Author: Alex Vigderman

  • Can adding Cam Newton stave off the demise of the Patriots dynasty?

    Can adding Cam Newton stave off the demise of the Patriots dynasty?

    By ALEX VIGDERMAN

    It’s not often that a move that everyone talks about as a potentially interesting story actually comes to fruition.

    Since Tom Brady’s official departure from the Patriots, people have been intrigued by the possibility of another former MVP stepping in to replace him in Cam Newton. Now we have the opportunity to find out not only what a Patriots offense looks like without Tom Brady, but what it looks like when it’s headed by one of the most prolific rushers to ever play quarterback.

    Of course, with Bill Belichick’s penchant for changing game plans wildly from week to week, it’s probably not prudent to try to guess at how the Pats’ offense might change with Cam under center. Instead, we’ll just compare Newton to Brady along a few dimensions, assessing where the Patriots might be able to sustain their performance and where they might fall back a bit.

    Newton certainly represents a downgrade from pre-2019 Brady, but last we saw Cam for a full-ish season he was roughly as effective as Brady was last year, so perhaps Patriots fans shouldn’t be concerned? Let’s run down a few narratives that could help inform the discussion.

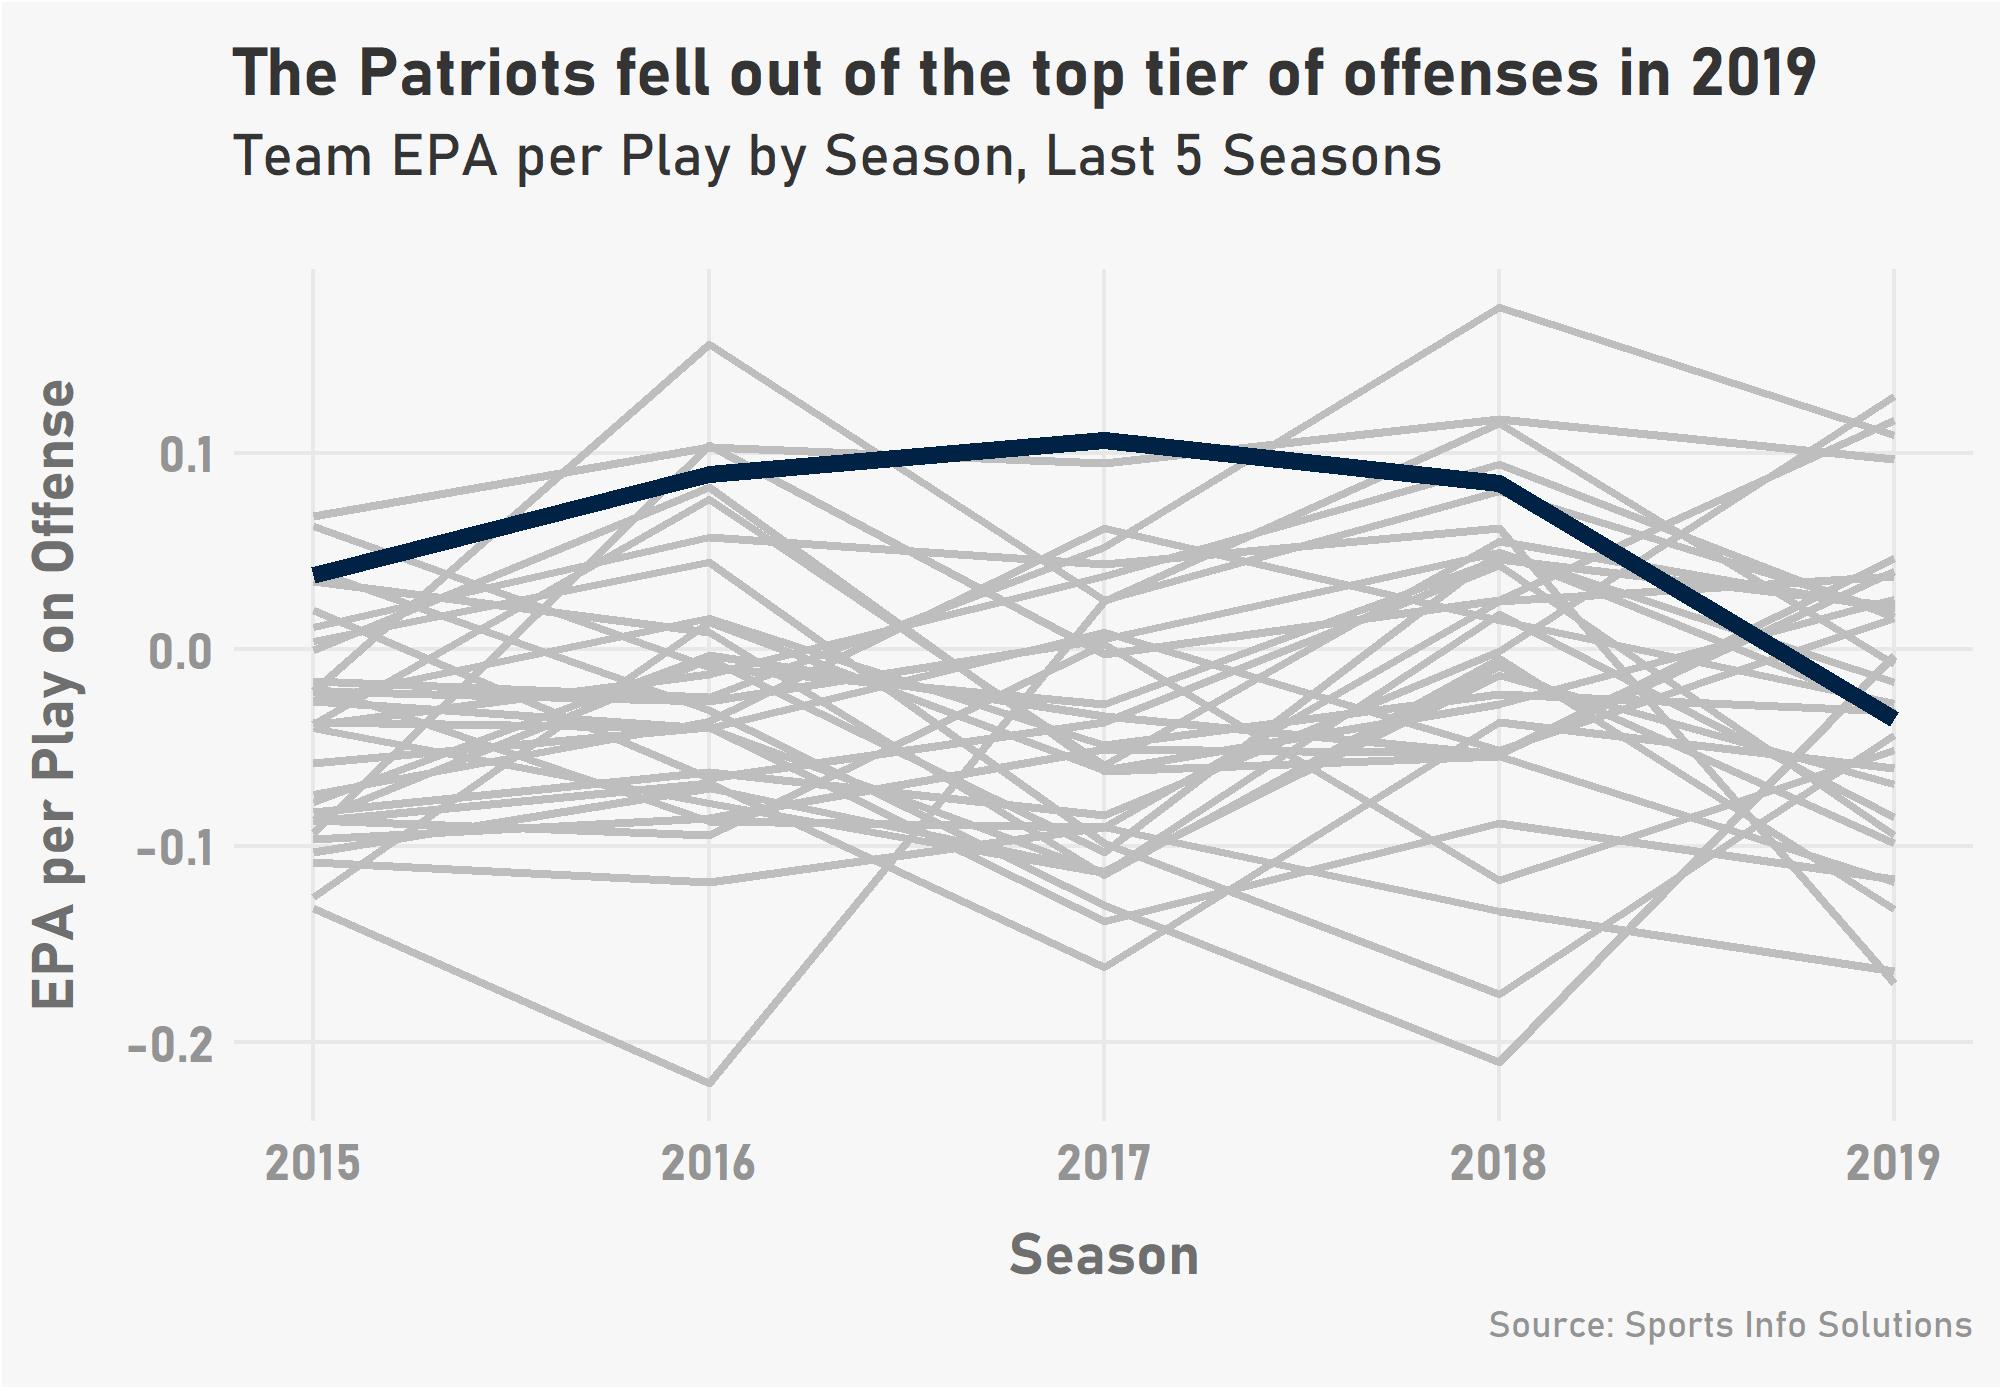
    The offense was in decline already, so the risk is low

    The biggest thing to keep in mind here is that the hole left by Brady isn’t nearly as big as it would have been had he departed a few years earlier. The Patriots had been mainstays in the upper tier of offenses with Brady at the helm, but 2019 was definitely a down year. Look at their decline in Expected Points Added per play.

    Brady himself didn’t decline as much in terms of total value as he did on a per-snap basis thanks to a top-five attempt total. He ranked barely outside the top ten in Total Points among quarterbacks, but on a per-play basis was very much in the middle class.

    Tom Brady’s Ranks Among Quarterbacks by Season

    SeasonTotal PointsTotal Points per Play
    20167th1st
    20173rd9th
    20186th8th
    201911th18th

    Newton’s precision in a quick-hitting New England offense

    This might be surprising given their reputations, but Newton has actually outperformed Brady on quick-hitting throws over the last two years. His 9.9 Total Points per 60 plays (TP/60) on zero-to-one step drops outpaces that of Brady (7.7) since the start of 2018.

    A corollary of the narrative about Newton’s accuracy is that he has a history of making the best out of bigger, slower receivers like Kelvin Benjamin and Devin Funchess because he doesn’t have Brady’s pinpoint accuracy. Moving from an offense headed by two sub-six-foot receivers (D.J. Moore and Curtis Samuel) and to one with some bigger targets (N’Keal Harry and Mohamed Sanu Sr.) could work out better for Cam than it had for Brady.

    For what it’s worth, if one of these quarterbacks does better with bigger targets, it’s Brady. Over the last two seasons, his Total Points per 60 plays when throwing to receivers at least 6’0″ tall improves, while Newton’s declines.

    Total Points per 60 Plays by Targeted Receiver Height, 2018-19

    Under 6’0″6’0″ or Taller
    Cam Newton11.97.4
    Tom Brady10.613.2

    Adding a new dimension via the running game

    Newton’s athleticism is the most obvious X factor. You don’t need any stats to convince you that Newton’s rushing ability could open up the offense in a way we’ve never seen. The Ravens showed with their transition from Joe Flacco to Lamar Jackson what kind of transformation an offense can make to support an elite athlete.

    That said, Cam hasn’t actually been that valuable with his legs, at least in recent seasons. Looking at the four years we have Total Points data for, he has actually cost his team value in three of the past four seasons. Some of that is the likelihood of fumbles on quarterback runs. But over the last four years he’s still only accumulated 6 Total Points on the more than 300 carries in which he didn’t fumble.

    It’s worth acknowledging that Newton’s impact on the running game isn’t just limited to his own carries. As Steven Ruiz points out, his presence should open up opportunities for his running backs because other teams have to account for his rushing ability. But considering the wear and tear his body has already sustained and the lack of history the Patriots have with such athletes at quarterback, it’s fair to be conservative on Newton’s potential value on the ground. But on a one-year incentive-laden contract, perhaps anything is possible schematically.

    The Final Word?

    The Patriots’ signing of Cam Newton is a spike of interest in what has otherwise been a quiet offseason among all the other things going on in the world. Unfortunately, there are so many question marks involved in this transaction. We’re talking about an injury-riddled player with a totally different athletic profile to that of a player who had spent two decades on the same team. Anyone trying to assess the situation analytically should be forgiven regarding the uncertainty.

    But it seems to me that these key narratives that people might point to for one reason or another are tending to go the opposite direction of what you’d think initially. And with Bill Belichick still at the helm of the Patriots, perhaps it is the best course of action to sit back and wait instead of assuming we know what will happen in Foxboro.

  • A quick introduction to our Analytics Challenge data set

    A quick introduction to our Analytics Challenge data set

    In case you missed it, we’ve announced a football analytics challenge! We’ll be releasing some data that can be used to evaluate defensive linemen, including individual player alignment pre-snap and play outcomes. Then, we ask you to determine which D-line position is the most important!

    This is the first time we’ve done anything like this, but we thought this was as good a time as any to start thinking about such a competition, because we can give the competition a purpose beyond the little sports analysis bubble we live in.

    There isn’t an entry fee for the competition, but we ask that all participants donate any amount they would like to the United Negro College Fund. We as a company want to do more to promote racial equality, and with your help, we can take a step (or many steps!) towards that goal.

    (By the way, even if you’re not interested in the competition, feel free to donate via the GoFundMe page we created for the challenge.)

    For those who want to explore some of our previously-unreleased data, maybe this brief article will help give you a lay of the land before you embark on the challenge!

    “What’s in the box”

    The data set used for the challenge combines both play-level information and player-level information from weeks 9 to 17 of the 2019 season into a single file.

    The play-level section includes basic play-by-play plus some extra data points like the Expected Points Added (EPA) of the play. There are also some interesting details about the play that might be relevant to your analysis, with a few data points specific to each of pass or run plays.

    The player-level section includes the identity of all of the up-front defenders on the play, their positions as named on the roster, their alignment on that play in particular, and a number of stats they might have accumulated.

    A player is included if he (a) was in a 3 point stance, (b) lined up standing on the edge on the line of scrimmage, or (c) usually lines up as a DL, even if he might have been up or off the ball on this play.

    Some of the stats included in the file are given at both a play level and a player level. For example, InterceptionOnPlay will tell you if anyone intercepted the pass, and Interception will tell you if the specific player referenced in that row intercepted the pass.

    A little extra info on defensive alignment

    Most of the data we’re releasing for this challenge is pretty self-explanatory to anyone who has played around with football data before. The defensive alignment info is probably the biggest exception.

    For starters, we have what we’re calling RosterPosition and OnFieldPosition. The former is just what we have the player labeled as on the roster. The latter is his position on the given play. In this context, that basically means “did you have your hand on the ground?” If “yes”, then you’re a defensive lineman. If “no,” then you’re a linebacker.

    The one piece that requires a little more football know-how is the technique (i.e. alignment) of the defenders on each play. In the file it’s called TechniqueName.

    The technique of a defender is encoded using a (mostly) numeric system where your alignment is measured by which offensive player you line up against and on which side of that player you line up. See this image from the SIS Football Rookie Handbook:

    Looking at this image, you can see that when people refer to “3-technique” or “5-technique” they’re talking about lining up just outside of either the guard or tackle. And the same structure is used for either side of the center, so you might have multiple players with the same technique on a given play, just on different sides of the center. The player’s side of the ball is encoded with SideOfBall, which is from the defense’s perspective.

    There’s also another data point that isn’t quite alignment-related but does convey specific information about what a player was doing on a given play. The IsRushing column tells you whether the given player was rushing the passer on designed pass plays. That column will always be zero on designed run plays.

    A few more notes on the data

    Event Types

    Unsurprisingly, there are run plays and pass plays in the data set. The EventType column tells you whether the play was a pass or a run—not by design, just in result. So a scramble would be counted as a run play for this purpose. There are also “Challenge pass” and “Challenge run” event types, which are just passes or runs where a replay review changed the call on the field.

    For the purposes of this kind of analysis, it’s likely fine to just assume that the “challenge” version of each event type is the same as the regular one.

    Run plays

    We have included RunDirection and UsedDesignedGap to help you analyze run plays based on where the play was designed to go and whether the offense succeeded in running that direction.

    The run directions are gap-based using the A-B-C-D naming convention (moving from inside to outside). A run to the left B gap, for example, was intended to go between the guard and the tackle on the left side.

    If a run was intended to go between the right guard and the center and the rusher bounced the run outside the tackles, RunDirection would be “Right A Gap” and UsedDesignedGap would be set to 0.

    Pass plays

    In addition to basic information like whether the pass was completed or intercepted, we have also included the air yards on the throw (ThrowDepth). At both the play level and player level, we’ve included information about Pressure (hits, hurries, knockdowns, sacks) and PassBreakup (defensed, batted, deflected, or intercepted passes).

    Penalties

    While we understand that the value of defensive players can be affected by their ability to draw offensive penalties (or commit penalties themselves), we decided that we would remove all plays with an accepted penalty from the data. There is enough gray area in how one should approach analyzing plays with penalties that it was decided to remove them from the picture.

    It’s going to be a fun month while we have this challenge going! If you have any questions about the data set or the competition in general, don’t hesitate to e-mail challenge@ww2.sportsinfosolutions.com.

  • “Kelly Leak” Infielders: Which corners are the most aggressive on grounders?

    “Kelly Leak” Infielders: Which corners are the most aggressive on grounders?

    A few years ago, MLB’s Mike Petriello wrote about Odubel Herrera being the “Kelly Leak” of outfielders, meaning that he often tried to field balls that were more difficult for him than it would have been for his teammate.

    The reference comes from “The Bad News Bears,” in which the character Kelly Leak would try to win at all costs, including going all-out to field any ball he had a shot at, even if another player was in better position. It’s great that you can get to a wide range of balls, sure, but sometimes it’s better to let someone else handle the play.

    With the new Defensive Runs Saved calculation we implemented a few months ago, we calculate the out probabilities necessary to answer this question for infielders. We can use the batted ball characteristics as well as the starting positions of each fielder to find plays where the corner infielder snags a grounder that the middle infielder actually had a greater chance of turning into an out.

    An example of how things can go very wrong would be this play, where Wil Myers ranges to field a ball that Freddy Galvis was very much in position to field, and he goes on to airmail the throw.

    Let’s take a look at the leaders in this bittersweet statistic. To qualify, the middle infielder who was cut off must have had at least a 20 percent chance of making the play if he had fielded it.

    Most Plays Fielding a Grounder When a Deeper Infielder Had a Better Chance
    2017-19 Corner Infielders; other infielder had at least a 20 percent out rate

    PlayerPosPlays
    Alex Bregman3B51
    Nolan Arenado3B41
    Joey Votto1B40
    Eugenio Suarez3B38
    Evan Longoria3B36
    Josh Donaldson3B31
    Rafael Devers3B30
    Justin Turner3B29
    Carlos Santana1B28
    Todd Frazier3B28

    What should be clear from the names on this list is that grabbing grounders that the numbers suggest you shouldn’t isn’t an indicator of poor defensive quality overall. Many of these names have made numerous appearances on Fielding Bible Award ballots in recent years. In fact, even on these potentially-troublesome plays, all of the players on this list saved runs in aggregate, with Alex Bregman’s eight runs leading the way.

    In general, that’s the case. Even if you make things harder on your team by ranging to make a play that another fielder might have made more easily, you are still likely to make the play. Of course, the onus is on you to execute once you field the ball, else you end up being the goat.

    Five players in the past three years have “Kelly Leaked” their teammates at least ten times and have cost their teams runs overall across these situations. Interestingly, two of them are Cubs infielders with strong defensive skill sets, so being on this list isn’t necessarily an indicator of faulty defensive instincts.

    Corner Infielders Who Cost Their Team Runs on “Kelly Leak” Plays
    2017-19 Corner Infielders, minimum 10 opportunities

    PlayerPosPlays
    Eric Hosmer1B12
    Anthony Rizzo1B14
    Kris Bryant3B14
    Josh Bell1B26
    Jake Lamb3B13
    NOTE: All of these players cost between zero and one run on these plays in total

    Say it Ain’t So, Renato!

    One player had a really rough go of things in this regard. In 2019 alone, on just three plays at first base, Orioles first baseman Renato Nuñez cost his team more runs than any of the above players by cutting off the second baseman on short grounders.

    On this play, Nuñez dove and then airmailed a throw from his knees. Rockies outfielder Raimel Tapia was running, so there was some risk associated with letting the ball by, but the second baseman was in good position and as you can tell Tapia wasn’t far down the line.

    This play was a much easier play for both possible fielders, as you can see by their positions. With a much slower Rockie running this time (Daniel Murphy), Nuñez again fails to complete the play by tossing the ball behind the pitcher coming over to cover the base.

    This last play ends up being quite close, to the point that it might not have worked out even if the second baseman fielded it. Ketel Marte is running here, so again there’s some urgency, and again Nuñez throws behind the pitcher covering the base.

    Nuñez’s ill-advised attempts granted three baserunners when letting the ball get to the second baseman likely would have eliminated them. Even if better throws would have changed the result, it’s important to emphasize that part of the reason Nuñez was in a worse position to make these plays is that the first baseman is moving away from the play when trying to make the throw to first, so the risk of an errant throw is part of the equation.

    While it hasn’t been the case for Nuñez, it is interesting to find that making inefficient split-second decisions in the field isn’t a deal-breaker in terms of your value as a defender. Of course, it helps to be an excellent defender, because you can make up for those foibles on the back end.

  • Dome-Field Advantage: How much does weather affect quarterback play?

    Dome-Field Advantage: How much does weather affect quarterback play?

    BY ALEX VIGDERMAN AND JOHN SHIRLEY

    Key takeaway: Weather has some predictable impacts, but maybe not at the scale that critics of dome-heavy quarterbacks think.

    ***

    How much do weather conditions affect quarterback play?

    This has been a hot topic following a tweet from the NFL’s Michael Lopez that pointed out that the list of the most effective quarterbacks over the last few seasons predominantly featured players whose home stadium was indoors. That prompted follow-ups from a few others, as well as Lopez himself. 

    We wanted to add a point or two to the conversation, starting with a blunt instrument and moving to a more nuanced approach. Think of it as “Weather Effects Two Ways.”

    Does the Roof Make You On Fire?

    We’ll start with just the impact of playing indoors versus outdoors. 

    It shouldn’t surprise anyone that games played indoors have better passing numbers. The effect is quite small, though. Since the start of 2015, passes thrown indoors have been completed 2.6 percentage points more often. For what it’s worth, the numbers are the same when looking at only road teams (reducing sampling bias) or only late-season games (when playing outdoors is most likely to be a concern).

    You might not notice the effect at a game level, but what about at a season level? 

    We took every pass over the last five seasons and split it on three dimensions: Indoor/Outdoor, Throw Depth, and whether the throw was outside the numbers.

    Again, only road teams were used to prevent oversampling from teams whose home stadium is indoors. Taking the average completion percentage of each group (and including some smoothing from similar throws), we can find an expected completion percentage by throw distance, both indoors and outdoors.

    Using these indoor and outdoor expected completion percentages, we took each quarterback season with at least 400 attempts and pretended they played for every other team that season (at least in terms of their proportion of indoor games versus outdoor games).

    In 2019, for example, every quarterback’s best performance would have come on the Falcons (81% of games indoors), and their worst performance would have come with either the Jets, Ravens, or Bengals (none of whom had an indoor game in 2019; the specific team would depend on what kinds of throws the quarterback made). 

    Here’s a visual of what those results look like.

    What do we learn from this?

    • If you switched between the most-indoor and most-outdoor schedules in any given season, quarterbacks’ completion percentages would change by at most two percentage points up or down
    • Quarterbacks who tend to play indoors (hello NFC South) are operating at the high end of their range of outcomes
    • This is not the best way to think about the effect of weather. Philip Rivers, Derek Carr, and Ryan Tannehill haven’t exactly played in adverse weather conditions, but they have played a very high percentage of their games outdoors.

    Let’s take things in a different direction, then, and focus on the actual weather conditions, not just whether the quarterback got his daily dose of Vitamin D.

    How Much Does Weather Really Matter?

    Weather effects on a player’s performance are talked about quite a bit, but generally in an anecdotal way with no underlying data. How many times do you hear about a quarterback prospect needing a strong arm to play in the northeast during every draft process?

    Similarly to indoor/outdoor effects on QB play, weather definitely plays a role, albeit a relatively small one.

    To determine this we took pass attempts from road teams playing outdoors over the past four seasons and modeled a relationship between completions and throw depth, whether the throw was outside the numbers, apparent temperature, and whether there was significant precipitation present.

    Apparent temperature accounts for wind speed, humidity, and air temperature. Significant precipitation is defined as any time the precipitation intensity was greater than or equal to 0.25 mm/hr (this accounts for the top 25% of throws with any level of precipitation). These two weather effects were found to be statistically significant within our model over the past four seasons.

    This weather-adjusted expected completion model was then compared to a simple model that only accounts for throw depth and whether the throw was outside the numbers. By comparing the two models, we can determine how much weather plays a role in the passing game and which quarterbacks were most affected.

    2019 QBs Most Negatively Impacted by Weather (min 200 Attempts)

    PlayerExpected Comp%Weather Adjusted Expected Comp%Difference
    Sam Darnold64.6%63.3%-1.3%
    Patrick Mahomes64.9%63.9%-1.0%
    Tom Brady66.0%65.2%-0.8%
    Aaron Rodgers64.0%63.2%-0.7%
    Russell Wilson63.1%62.4%-0.7%

    2019 QBs Most Positively Impacted by Weather (min 200 Attempts)

    PlayerExpected Comp%Weather Adjusted Expected Comp%Difference
    Matt Ryan65.2%66.9%1.7%
    Jacoby Brissett65.5%67.1%1.6%
    Matthew Stafford61.2%62.6%1.4%
    Drew Brees67.6%68.8%1.2%
    Kyler Murray66.3%67.5%1.2%

    Unsurprisingly, a quarterback who played the majority of his games in the northeast, Sam Darnold, topped the list of players most affected by weather conditions. On the other side of things, we see a list of quarterbacks who played most of their games indoors as the most positively affected by weather conditions. However, the overall effect from weather is fairly small either way. 

    The Big Picture

    Regardless of the method used, we see that having great or terrible weather over the course of a season can modulate a quarterback’s completion percentage by one or two percentage points. Michael Lopez found something similar, but also noted that the indoor/outdoor effect is larger than that of home field advantage, which has some interesting ramifications on things like point spreads. 

    Given these results, it seems a player’s typical weather conditions aren’t likely to be a big deal from season to season. The effect can of course accumulate, as in the case of players like Drew Brees, who has spent his entire career in favorable weather between San Diego and New Orleans. Drop his completion percentage by one point over his career, keeping the same yardage per completion, and he loses just under 1,000 passing yards over his career. For guys like that it only matters in the context of all-time records and Hall of Fame discussions, and even then only as a minor point in a larger discussion. 

    The key point to keep in mind is that there are lots of variables that affect a player’s statistics beyond his talent, and we need to understand the scale and direction of those effects when trying to evaluate players. Weather has some predictable impacts, but maybe not at the scale that critics of dome-heavy quarterbacks think.

  • Where did your team fall on the filling needs / drafting value spectrum?

    Where did your team fall on the filling needs / drafting value spectrum?

    By ALEX VIGDERMAN
    There is already a veritable corpus of NFL Draft recap content out there. So, to differentiate, here’s a recap that features few opinions and hinges on a statistic that no one else is in a position to use as the basis for their recap.

    We’ve told you before that we implemented a college version of our catch-all football statistic, Total Points. We use a player’s full body of work (provided he went to an FBS school) and tabulate his value in terms of Expected Points Added, tacking on an adjustment for the quality of competition he faced.

    I suspect that by next year we’ll have a model for draft pick value, but for now I’m not so comfortable with implementing such a thing because we only have two seasons of Total Points data in college. I’m certainly excited for that to come.

    For this piece, to keep things nice and clean, I calculated a weighted average of each player’s Total Points over the past couple seasons and added up these averages for every pick for every team. That gives us a rough estimate for how much value a team got from its picks.

    Each team’s needs were based on the data used for the Football Rookie Handbook team pages, but updated for changes post-free-agency. I estimated the extent of a need by subtracting from 100 percent each team’s percentile rank at a position. For example, the Bengals were in the third percentile at QB before drafting Joe Burrow No.1, so they had a need denominator of 97 percent.

    To measure how well a team met its needs, I took a simple measure. If you drafted a player in the first three rounds at a position, you got credit for filling the need. If you only took players on Day Three to fill that need, you got half credit.

    Sum up the need totals and divide the acquired player totals by that, and you get a percentage of needs filled. Simple, clean, and pretty accurate of how we’d evaluate a team. The Bengals and Packers each took a quarterback in the first round, but because the Bengals had a much larger need they get much more credit for their selection.

    Let’s take a look at how teams fared by this method.

    * A few teams are hidden in clusters of teams in the image above. The Browns, Broncos, and Cowboys are right in the middle of the graph, and the Buccaneers are clustered with the Panthers and Patriots a little below that.

    High-value picks that filled needs

    The Vikings have gotten a lot of credit for accumulating picks over the course of the draft, and you can see the fruits of their labor by how far ahead of everyone else they are in terms of Total Points acquired. Taking a quarterback at all (Iowa’s Nate Stanley) helps, but they also loaded up on high-performing defensive players in the back end of the draft.

    The Ravens didn’t have a glut of selections, but they targeted holes really efficiently. Their three biggest needs by a mile were at defensive tackle, wide receiver, and linebacker. They spent four picks in the first three rounds on those positions alone.

    Got value but didn’t fill needs

    The other team that had a ton of picks to work with was the Dolphins, who get a lot of credit for taking Tua Tagovailoa at the top of the first round. Their other picks in the first round were a mixed bag in terms of filling needs, though, as they addressed a dire need along the offensive line with USC’s Austin Jackson, but their selection of cornerback Noah Igbinoghene from Auburn comes off as odd considering that was a position of relative strength last season.

    Filled needs efficiently

    Teams that fell into this category tended to be Super Bowl 54 participants, interestingly.

    The 49ers only made five selections in the draft, but they attacked spots that made sense. They traded Marquise Goodwin during the draft, and then drafted multiple wide receivers (including first rounder Brandon Aiyuk of Arizona State) after also losing Emmanuel Sanders to free agency. They filled another need created by a trade by taking Javon Kinlaw to replace DeForest Buckner at defensive tackle.

    The reigning Super Bowl Champion Chiefs were also short-handed from a draft pick perspective, but they did well with the resources they had. Kansas City struggled at linebacker in 2019, so the selection of Willie Gay Jr. from Mississippi State in the second round was crucial to their draft success. And while there is reason to quibble with the draft capital used, adding a dynamic running back to the mix in Clyde Edwards-Helaire from LSU makes that offense even more threatening.

    Low value, didn’t fill needs

    To some extent it’s unfair to punish teams that had few picks, but the Saints didn’t use their limited bullets to the same effect that the teams above did. Their first round pick, Cesar Ruiz from Michigan, is more of a depth selection from a 2020 perspective considering the current state of New Orleans’ offensive line. And while it’s still prudent to take shots at quarterbacks with Drew Brees nearing the end of the line, by this method spending one of your four picks on a QB doesn’t look very efficient.

    The Bears‘ draft was unlikely to be evaluated very well by this method, considering they already traded for Nick Foles to bolster their quarterback room and just drafted David Montgomery so they were unlikely to use a lot of capital to replace him. That said, besides spending multiple picks on their biggest need (cornerback) they failed to address any of their next five biggest needs from a Total Points perspective.

  • Minor League Defenders to Watch According to Keith Law

    By ALEX VIGDERMAN

    Monday’s episode of the SIS Baseball Podcast featured The Athletic’s Keith Law, whose book “The Inside Game: Bad Calls, Strange Moves, and What Baseball Behavior Teaches Us About Ourselves” comes out April 21.

    The conversation largely consisted of discussion of some of the cognitive biases that affect all of us to some extent and particularly baseball decision makers in the realm of player evaluation and roster construction (for those wondering about the board game Keith recommended at show’s end, Jaipur, is available virtually in multiple locations).

    The last bit of the interview included Keith mentioning the prospects we should be interested in from a defensive perspective. Two of those names have come up in previous podcast episodes, and another might surprise you given his position.

    Cristian Pache, Braves CF (FanGraphs Prospect Rank: 20)

    We start with a name that I’ve heard a few times in prospect discussions over the offseason in Braves outfielder Cristian Pache. Unfortunately, he isn’t likely to play center field in the majors any time soon because arguably the best young player in baseball is currently manning that spot (Ronald Acuña Jr).

    A move to a corner position should be just fine for Pache, who in his age-20 season split time across all three outfield positions. That included saving nine runs in just 20 games in right field, which was second at the position (he was among the defensive standouts mentioned on the September 4 episode of the podcast).

    Pache’s arm shone in a small sample across Double-and-Triple-A, allowing only five runners to advance and retiring three runners without the use of a cutoff man in just 13 opportunities. Both of those rates were much better than the minor league average in 2019.

    Ke’Bryan Hayes, Pirates 3B (FanGraphs Prospect Rank: 30)

    Ke’Bryan Hayes was the guest on the SIS Baseball Podcast on August 20th, primarily because of his reputation with the glove (he’s won the Minor League Gold Glove at third base three years running). He ranks second in Defensive Runs Saved among minor league third basemen with at least 1,000 innings over the last two seasons, trailing only the Rockies’ Josh Fuentes (who won’t be making much noise at the hot corner any time soon, as he’s blocked by Nolan Arenado).

    One of Hayes’ calling cards defensively is the jumping catch. He recorded the out on 11 plays where our Video Scouts saw him to field the ball over the last two seasons, which was second-most in the minors in the games we charted. His 73 percent success rate (11 for 15) tied for the best among those with at least 10 jumping attempts.

    Evan White, Mariners 1B (FanGraphs Prospect Rank: 64)

    If they say there’s no such thing as a first base prospect, imagine what “they” might say about a first base prospect on defense. Evan White might break that mold, and the Mariners are betting on that. They signed him to a six-year extension that was the first ever for a player without experience above Double-A.

    White won the Minor League Gold Glove at first in 2018 after winning a couple collegiate Gold Gloves while at Kentucky. He followed that up in 2019 by ranking third among qualified minor league first basemen in Defensive Runs Saved.

  • Who’s best/worst at going left and right?

    By ALEX VIGDERMAN

    We just finished up our first ever Tournament of Defensive Excellence, with Andrelton Simmons coming out on top as the best defensive player of the 21st century via a series of Twitter polls. He bested Matt Chapman in the finals in a battle of modern titans.

    When you think about players at that level of skill, you don’t find too many aspects of glovework that they struggle with. Neither Simmons nor Chapman have rated as below average in any Defensive Runs Saved (DRS) component over their careers, and that could be said about many of the top defenders who graced that competition.

    Most players, however, have some kind of imbalance in their skill set. They might have an outstanding throwing arm but handle called pitches poorly (in the case of catchers).

    Today we’ll take a look at infielders who do much better going to one side than the other.

    Biggest Differences Between Runs Saved to Left and Right
    2017-19 Infielders 

    PlayerPositionTo His LeftTo His RightDifference
    Xander BogaertsSS1-3839
    Tim AndersonSS-26329
    Nolan Arenado3B29128
    Jean SeguraSS-121325
    Jed Lowrie2B-15924
    Matt Olson1B02323
    Joey Votto1B52722
    Daniel Murphy2B2-1820
    Rougned Odor2B10-1020
    Alcides EscobarSS-21-120

    Red Sox SS Xander Bogaerts is as far from an ambi-turner as you can get. He has cost Boston 38 runs on plays to his right (generally in the SS-3B hole) over the last three seasons.

    Bogaerts’ defensive narrative changed a few years into his career, partially affected by his positioning.

    Xander Bogaerts Career Defensive Runs Saved Splits at SS

    SeasonsTo His LeftTo His RightRangeThrowing
    2013-16-2-1110-26
    2017-191-38-28-8

    Through 2016, he was relatively balanced directionally, while he struggled much more with throwing than range. Since then, he’s performed quite poorly on plays to his right, and his misadventures have been more about range than throwing. Part of that has to do with being positioned more up-the-middle than the average shortstop, making him less likely to even get to balls in the SS-3B hole in the first place.

    One player who’s on the other side of the ledger is Nolan Arenado, who was upset in the second round as a 2-seed in the Tournament of Defensive Excellence. Over his career, Arenado has saved 68 runs on plays to his left, compared to 10 on plays to the right.

    As opposed to Bogaerts, Arenado has been quite consistent in his profile over the years. On just plays to his left, he’s saved at least four runs with range every year, saving as many as twelve (in both his first and most recent season, interestingly). On those plays, he’s saved between two and three runs in all but two seasons.

    Arenado’s excellence moving to his left has to do with his forehand glovework. His 93.7% success rate on forehand plays is the highest among third basemen over the last three seasons.

    Most Successful Third Basemen on Forehand Plays, 2017-19
    Minimum 750 Opportunities

    PlayerSuccess Rate
    Nolan Arenado93.7%
    Todd Frazier93.5%
    Justin Turner92.5%
    Travis Shaw92.3%
    Anthony Rendon91.8%
    Jose Ramirez91.8%

    Fans of Arenado might be a little bit surprised that he only rates as average on plays to his right (typically balls hit down the line). One reason for that might be that he has a flair for the dramatic, making us think he’s more outstanding than he is. He’s attempted to barehand 123 balls over the last three seasons, almost doubling the next third baseman (Travis Shaw, 63), and his 49% success rate on those plays also tops the position.

  • Could a shortened MLB season give us surprising contenders?

    By ALEX VIGDERMAN

    A lot about the 2020 MLB season is uncertain.

    When will it start?

    How many games will be played?

    Will they play at all?

    If they do play, is there a chance the structure of games is modified to fit in a more representative number of games?

    Let’s assume there is a season, but it’s something notably short of a full one. The fun part about a shortened season (acknowledging that we’re talking about less fun overall) is that there’s a much greater chance of a team sneaking into the playoff picture that you wouldn’t have expected. We see more upsets in five-game series than we do in seven-game series, so what about an 81-game season versus a full one?

    Let’s see just how much a short season could throw things off, and how the shorter the season gets, the more chaos we might see.

    For this exploration I created simulated seasons by drawing random games from the actual 2019 game-by-game results. The simulated seasons have durations ranging from 162 all the way down to 27. Because I didn’t have the time or inclination to do these simulations with fully-balanced schedules, some teams ended up with more or fewer games than the target number. To balance that out a bit, I simulated 200 seasons of each length and only used the 100 most balanced.

    Once I had 100 simulated seasons of a given number of games per team, I took a rough estimate of the playoff-worthy teams by taking the top 10 teams by win percentage in each pseudo-season. Because these are all simulations anyway, I made the perfect-sphere-rolling-down-a-frictionless-inclined-plane of baseball seasons by removing divisions and just labeling the top 10 teams by win percentage as playoff caliber. Last season, for example, that would have put the Indians in the playoffs and left the Brewers out.

    Here’s one way to think about how shortening the season might affect competitive balance. For each season duration, how many teams would make the “playoffs” at least once in a hundred simulations? At least ten times? Twenty?

    Teams That Made the Playoffs at Least N Times in 100 Simulations

    By Number of Games in Season

    Season Length

    Made Playoffs
    Once

    Made Playoffs
    10 Times
    Made Playoffs
    20 Times
    27 Games28 Teams21 Teams15 Teams
    54 Games23 Teams16 Teams15 Teams
    81 Games19 Teams15 Teams12 Teams
    108 Games16 Teams13 Teams12 Teams
    135 Games15 Teams11 Teams11 Teams
    * “Playoffs” meaning that the team ranked among the top 10 teams by Win%


    So what do we get from this table?

    • Shorter seasons give bottom-feeders a fighting chance. While half the league made the “playoffs” at least once in a hundred 135-game seasons, every team but two made it at least once in a 27-game season (sorry Tigers and Marlins fans).
    • If you want something more than a fighting chance, you really do have to be a better-than-average team even in a ridiculously short season. Even in a preposterously short season, only half the league had even a one-in-five shot at making the “playoffs.”
    • If we are looking at a nice clean half season, the middle class of teams should expect to have a shot, but we should really just focus our attention on the teams that would normally be in Wild Card contention anyway.
  • What to Expect Now That Shifts are Included in Defensive Runs Saved

    By Alex Vigderman

    You might have heard that we have a new Defensive Runs Saved as of this offseason. The nice thing is that even with 2020 baseball lagging behind a bit, these changes were implemented all the way back to 2013. What sort of fun can we have with that data?

    Well, one of the big-ticket changes that we made was to add shift plays back into player evaluation. Since the start of the shifting boom in 2012, we eliminated from evaluation any plays with a shift on. However, as shifts started representing roughly half of all balls in play as recently as this season, that became an untenable strategy. So now Defensive Runs Saved includes virtually all plays.

    How Much of an Impact Does Including Shift Plays Have?

    If shifts represent roughly half of balls in play, you shouldn’t be surprised that they have quite a bit of sway in our understanding of player value. Here’s how much that amount has changed over the years, using the proportion of total runs saved or cost (i.e. the absolute value of runs saved) that comes from shifts. This includes the Range and Throwing parts of the new PART System, because we don’t split performance on air balls in this way and positioning isn’t assigned to the player.

    Percent of Total Runs Saved or Cost on Shift Plays by Season, 2013-19 Infielders

    SeasonPercent of Total Runs Saved or Cost
    201311%
    201419%
    201525%
    201631%
    201730%
    201835%
    201943%

    At a player level, shift plays can be worth double-digit runs over the course of a season, although that’s only the very end of the spectrum. Who was affected the most?

    Most Runs Saved on Shift Plays, 2019 Infielders

    PlayerPosRuns Saved
    Kolten Wong2B14
    Paul DeJongSS12
    Kike Hernandez2B11
    Nolan Arenado3B11
    Javier BaezSS10

    Most Runs Cost on Shift Plays, 2019 Infielders

    PlayerPosRuns Saved
    Jurickson Profar2B-12
    Colin Moran3B-8
    Richie Martin Jr.SS-7
    Jorge PolancoSS-7
    Asdrubal Cabrera2B-7
    Gleyber Torres2B-7
    Rio Ruiz3B-7


    How Does Shift Performance Relate to Performance in a Standard Alignment?

    One thing you might notice from the leaders and trailers above is that the leaderboard tended to include players we already thought were strong defenders and the trailerboard tended not to. This all makes sense, because good players tend to be good regardless of the situation.

    Interestingly, in the aggregate our assumption seems to be misguided. Comparing the performance of players in shifts to their performance in standard alignments, the correlation is essentially non-existent.

    Correlation between Performance in Shifts and Standard Alignments, 2013-19 (using new PART System)

    DRS ComponentCorrelation between Shift and Standard
    Positioning0.03
    AirN/A (not calculated in shifts)
    Range0.13
    Throwing0.09

    Stats are all on a per-opportunity basis, and small samples are down-weighted when calculating the correlations

    This certainly is an odd finding, and the reason for it isn’t clear just yet. It’s possible that when players are re-positioned for a shift the distribution of their out rates transforms enough that while their actual skill isn’t changed, the way that their skill is reflected in their plus-minus-based statistics does, ahem, shift.

    There is just enough of a small positive correlation that over a full season of opportunities better players will tend to have positive Runs Saved in shifts and worse players will tend to have negative Runs Saved in shifts, but that’s about as much of a relationship that there is. This bears more investigation, but we wanted to at least report the finding and see where things go from there.