Sports Info Solutions
Author: Andrew Kyne
-
Preview: Alabama vs. Clemson, College Football National Championship
By
Looking for a number that’s important to tonight’s game? You’ve come to the right place.
-
Stat of the Week: A Statistical View of the College Football Playoff Field
By
The College Football Playoff field is set: the semifinal games on December 29 will feature No. 1 Alabama against No. 4 Oklahoma, and No. 2 Clemson against No. 3 Notre Dame. All four teams have had interesting storylines at quarterback, while also dominating in other facets of the game. Using Sports Info Solutions’ advanced metrics…
-
Visualizing the Range of MLB’s Best and Worst Outfielders in 2018
By
By ANDREW KYNE The primary component of Baseball Info Solutions’ Defensive Runs Saved metric is the Range & Positioning system, which rates each fielder’s success at converting batted balls into outs. Fielding Bible Award winners Alex Gordon (LF), Lorenzo Cain (CF), and Mookie Betts (RF) were among the best at their respective positions in 2018…
-
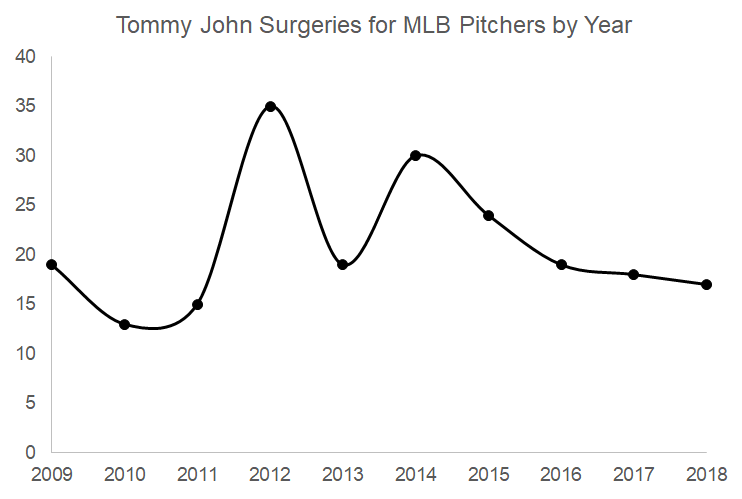
Stat of the Week: Tommy John Surgery in Major League Baseball
By
This month, two of baseball’s promising young pitchers—Shohei Ohtani of the Angels and Michael Kopech of the White Sox—learned that they will likely need Tommy John surgery due to torn ulnar collateral ligaments in their throwing arms. While Ohtani remains in the Angels’ lineup as a hitter, Kopech’s debut season is over after fewer than…
-
Numbers show improvement in Eric Hosmer’s range
By
by ANDREW KYNE Evaluation of San Diego Padres first baseman Eric Hosmer’s defense has long differed between the eye test and metrics such as our Defensive Runs Saved (DRS). Scouts and coaches have considered the Padres’ new first baseman to be among the league’s best at the position, while the numbers have typically rated him…
-
Visualizing the Range of MLB’s Best and Worst Outfielders
By
Baseball Info Solutions’ Defensive Runs Saved (DRS) metric measures a player’s total defensive contribution at a given position, compared to league average. The primary component, as outlined in The Fielding Bible, is the company’s Range & Positioning system, which rates each fielder’s success at converting batted balls into outs. Using BIS’s batted ball locations, we…
-
The Best Team Defense Improvements of 2015
By
On the heels of Kansas City’s improbable postseason run in 2014 and now successful start to 2015, baseball has been further exposed to the importance of team defense. With an electrifying outfield headlined by 2014 Fielding Bible Award winners Lorenzo Cain and Alex Gordon, the Royals have owned the American League’s best defense since the beginning of 2014 by BIS’s…