Sports Info Solutions
Author: James Weaver
-
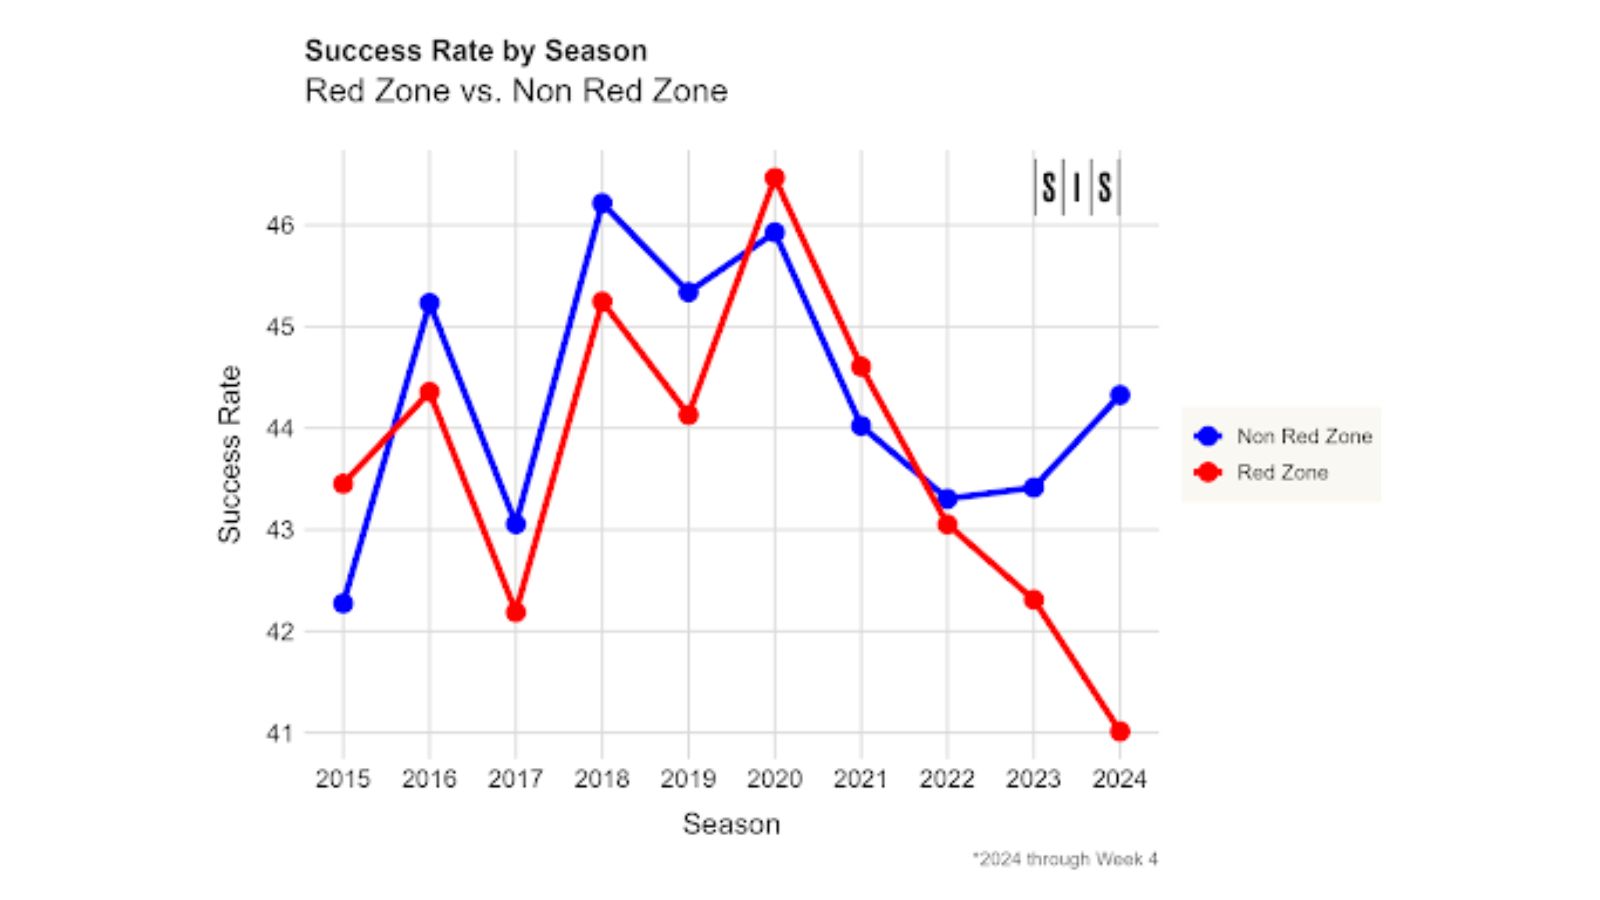
Study: What’s Going On With Red Zone Offense?
By
Overall, success in the red zone has declined faster than success in non red zone situations. Specifically, the accuracy of quarterbacks has dropped off a cliff
-
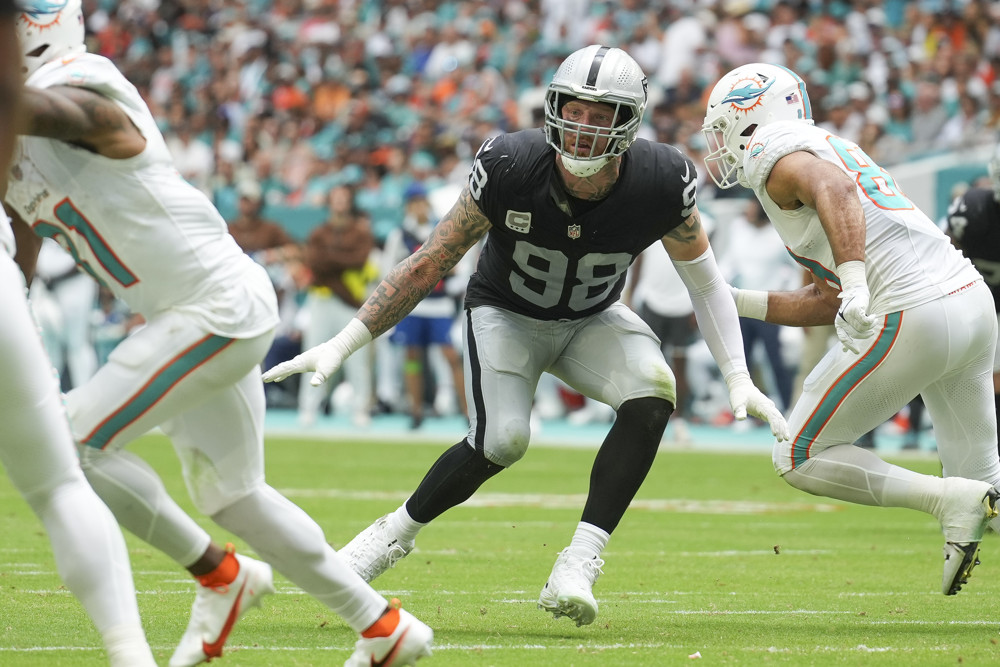
2024 AFC West Preview
By
It’s easy to say the Chiefs are going to win the division, but a team like the Raiders could make a big impact too.
-
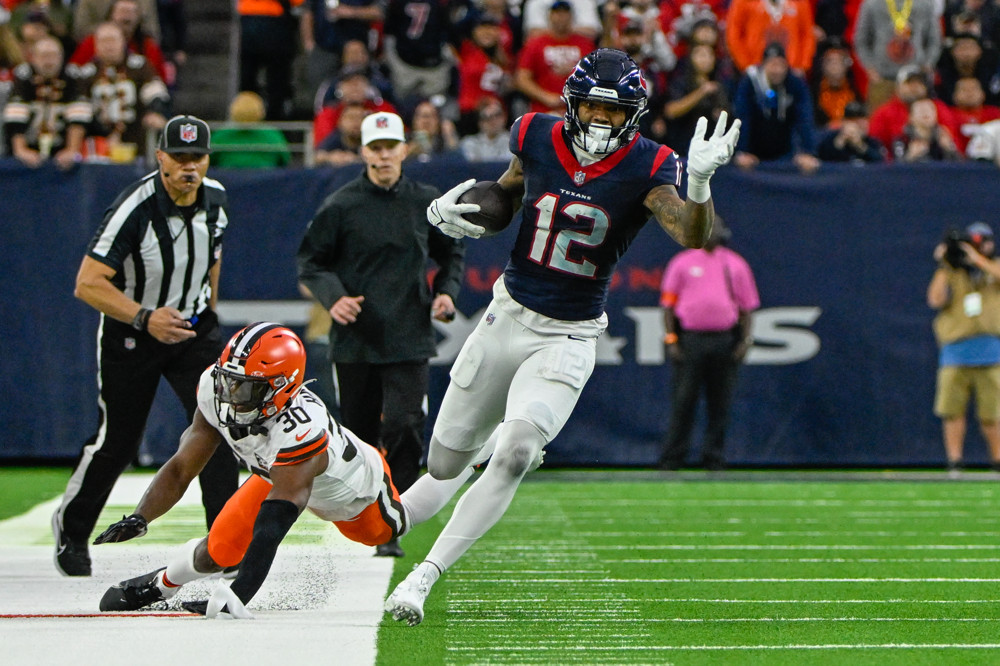
Off The Charts Division Preview: AFC South
By
Nico Collins is part of a highly-potent receiving group for the Texans.
-
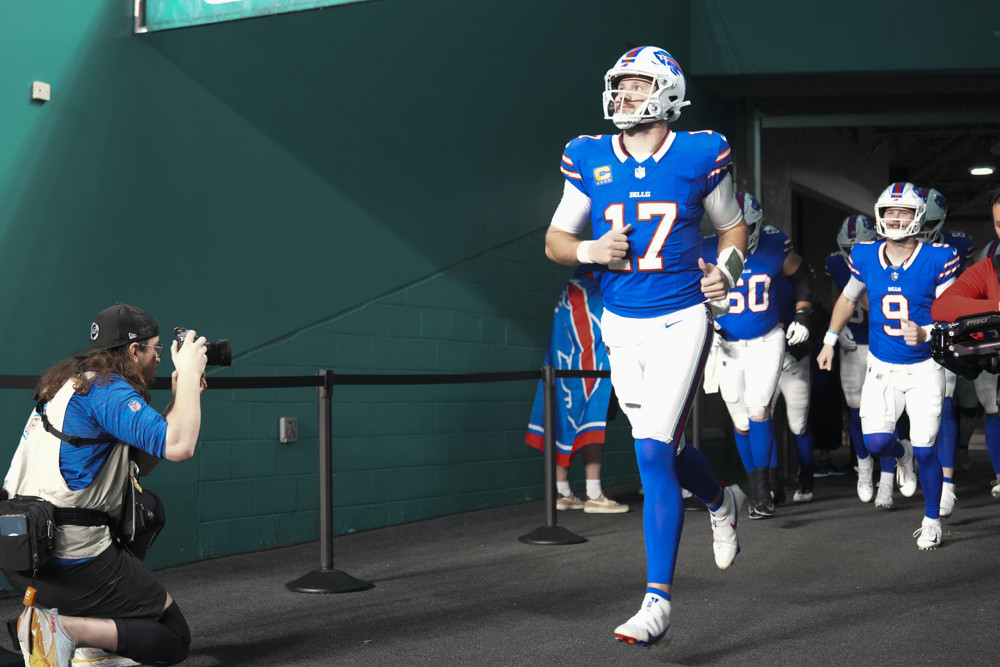
Off The Charts Division Preview: AFC East Has 3 Super Bowl Contenders
By
Josh Allen helming a ‘soft rebuild?’ How good does Aaron Rodgers have to be? What to make of the Dolphins D? How will the Patriots transition to a vertical passing game? We look into these questions.
-
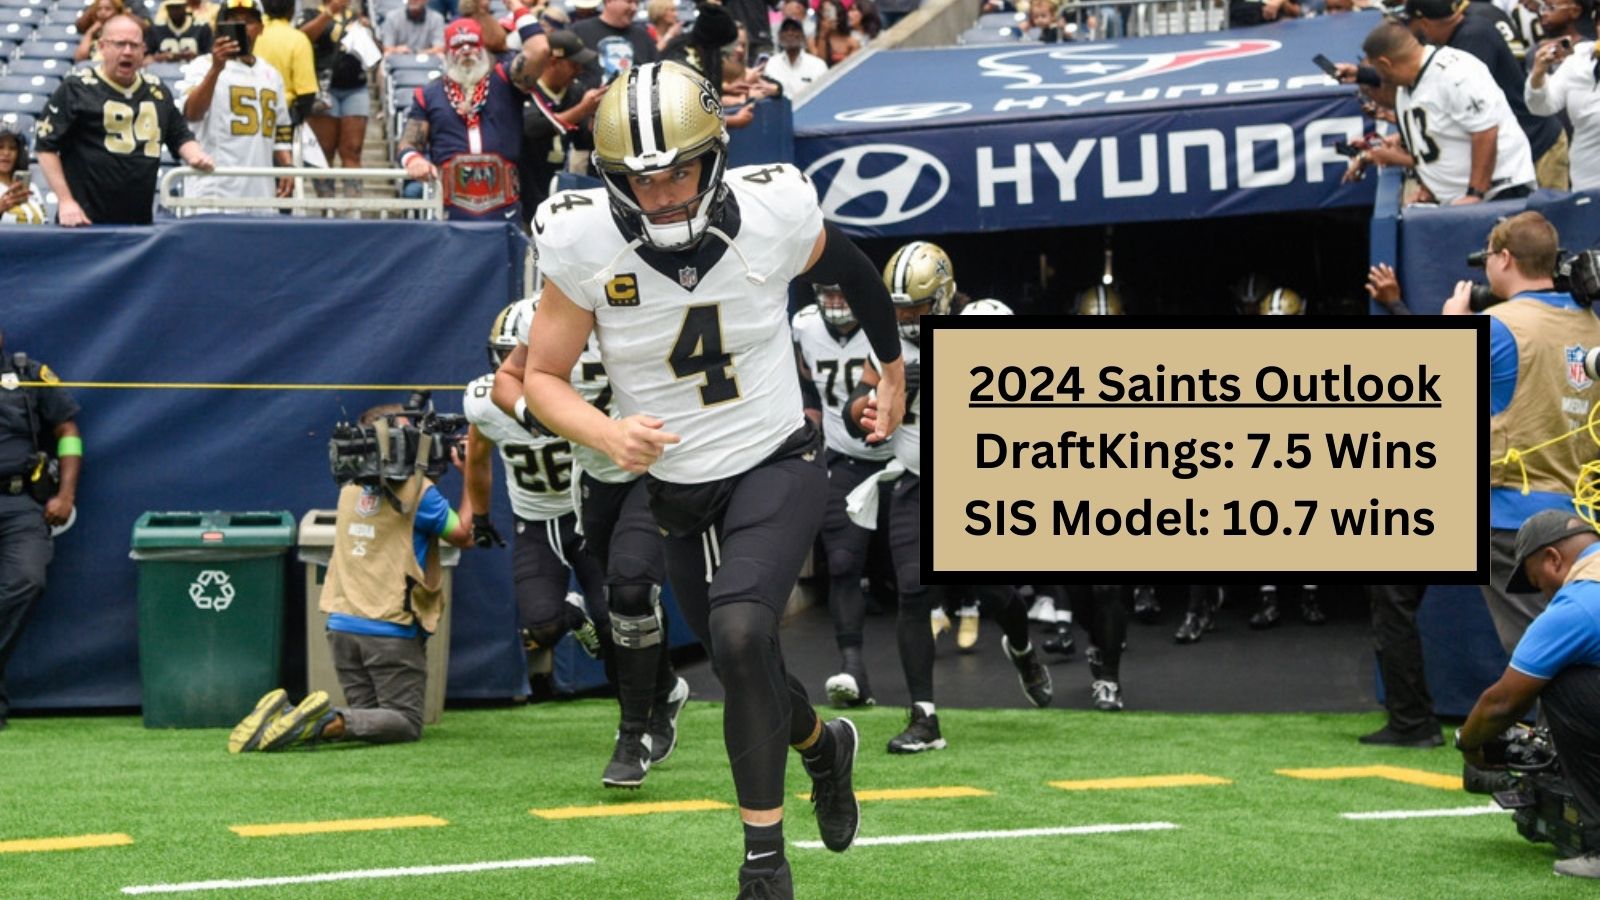
Analyzing NFL Win Totals with the SIS Prediction Model
By
We’ve reached prediction season for the NFL. A big part of dissecting the upcoming season is analyzing the schedule and predicting which teams will overperform or underperform their expectations. Expectations these days come from the sportsbooks, especially through win totals. These markets have been posted and bettors have begun forming their stance on each individual…
-
Under Pressure? Projecting Sack Numbers using Advanced Pass Rushing Metrics
By
What stats best project future sack totals and what predictions can we make for some of 2024’s key player?
-

A Mathematical Realignment of FBS College Football Conferences
By
Say goodbye to the Power 5, and hello to the Premier 16, the Pac-17 and much more!
-
The Sniff Test: What Metrics From 2022 Provide A Signal For 2023?
By
On the latest episode of the Off the Charts Football Podcast, Matt Manocherian and James Weaver dove into the SIS Data Hub ($) and uncovered some of the most surprising stats from the previous season. The question they asked themselves was: Does this stat pass the sniff test? They wanted to figure out if if…
-
Scouts vs Stats: The NFL’s Top Linebackers & Safeties
By
There was close to a consensus on the excellence of Fred Warner, but our groups differed on Grant Delpit. See who joined them in rating among the best of the best.
-
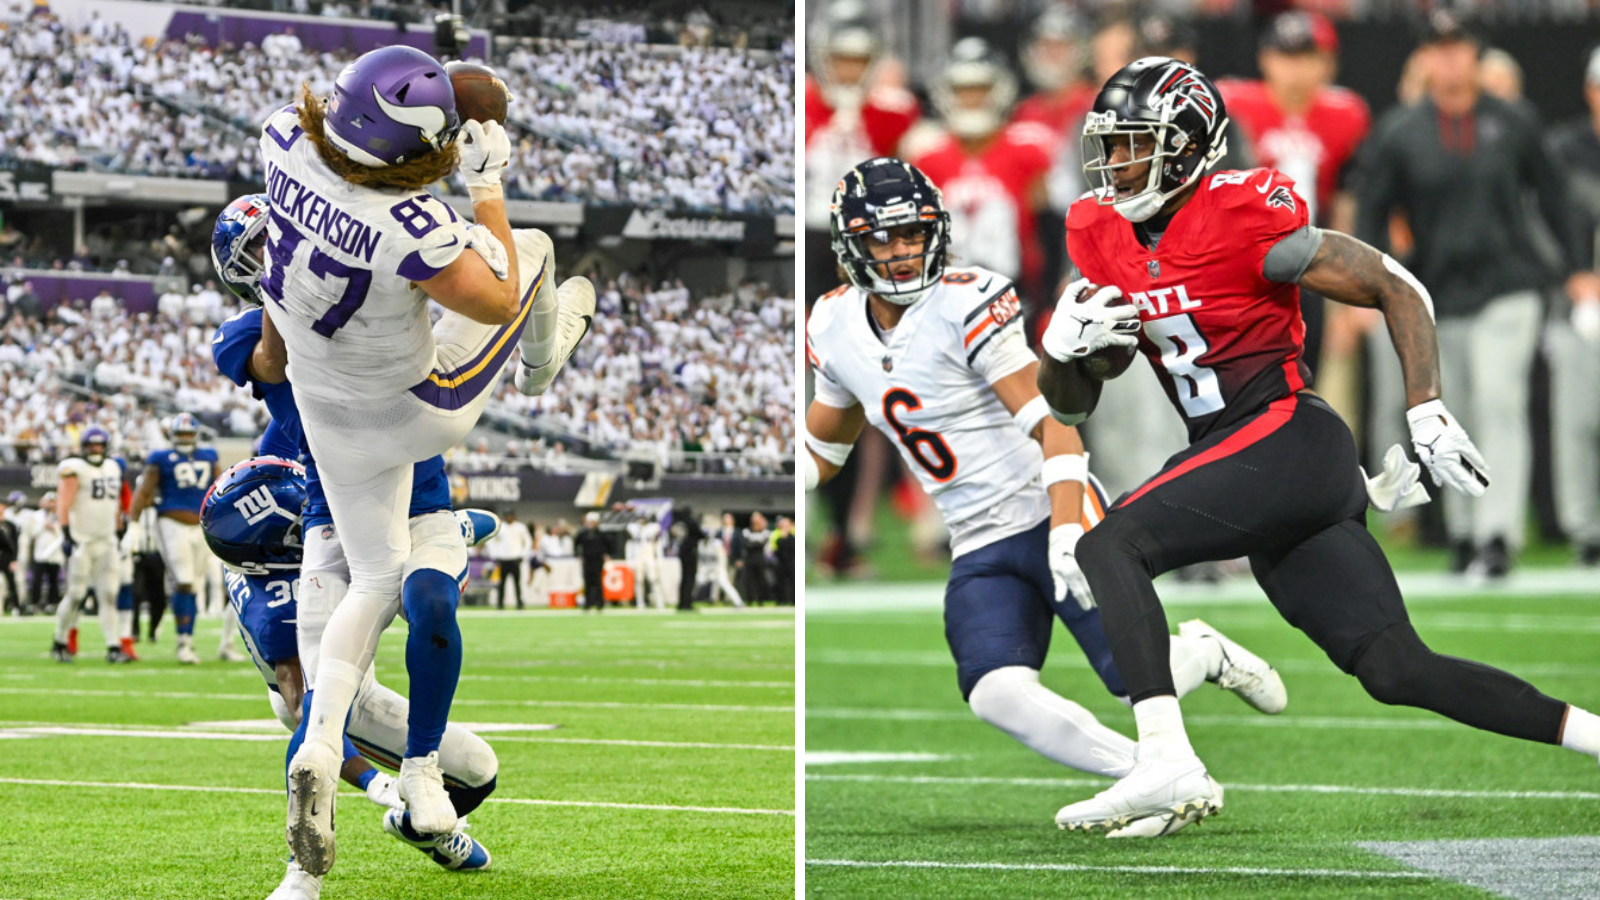
Scouts vs Stats: Debating The Top 10 NFL Tight Ends
By
The suspense here isn’t over who’s in the Top 3, but rather where players like T.J. Hockenson and Kyle Pitts slot in within our stats and rankings.