Sports Info Solutions
Author: Nate Weller
-
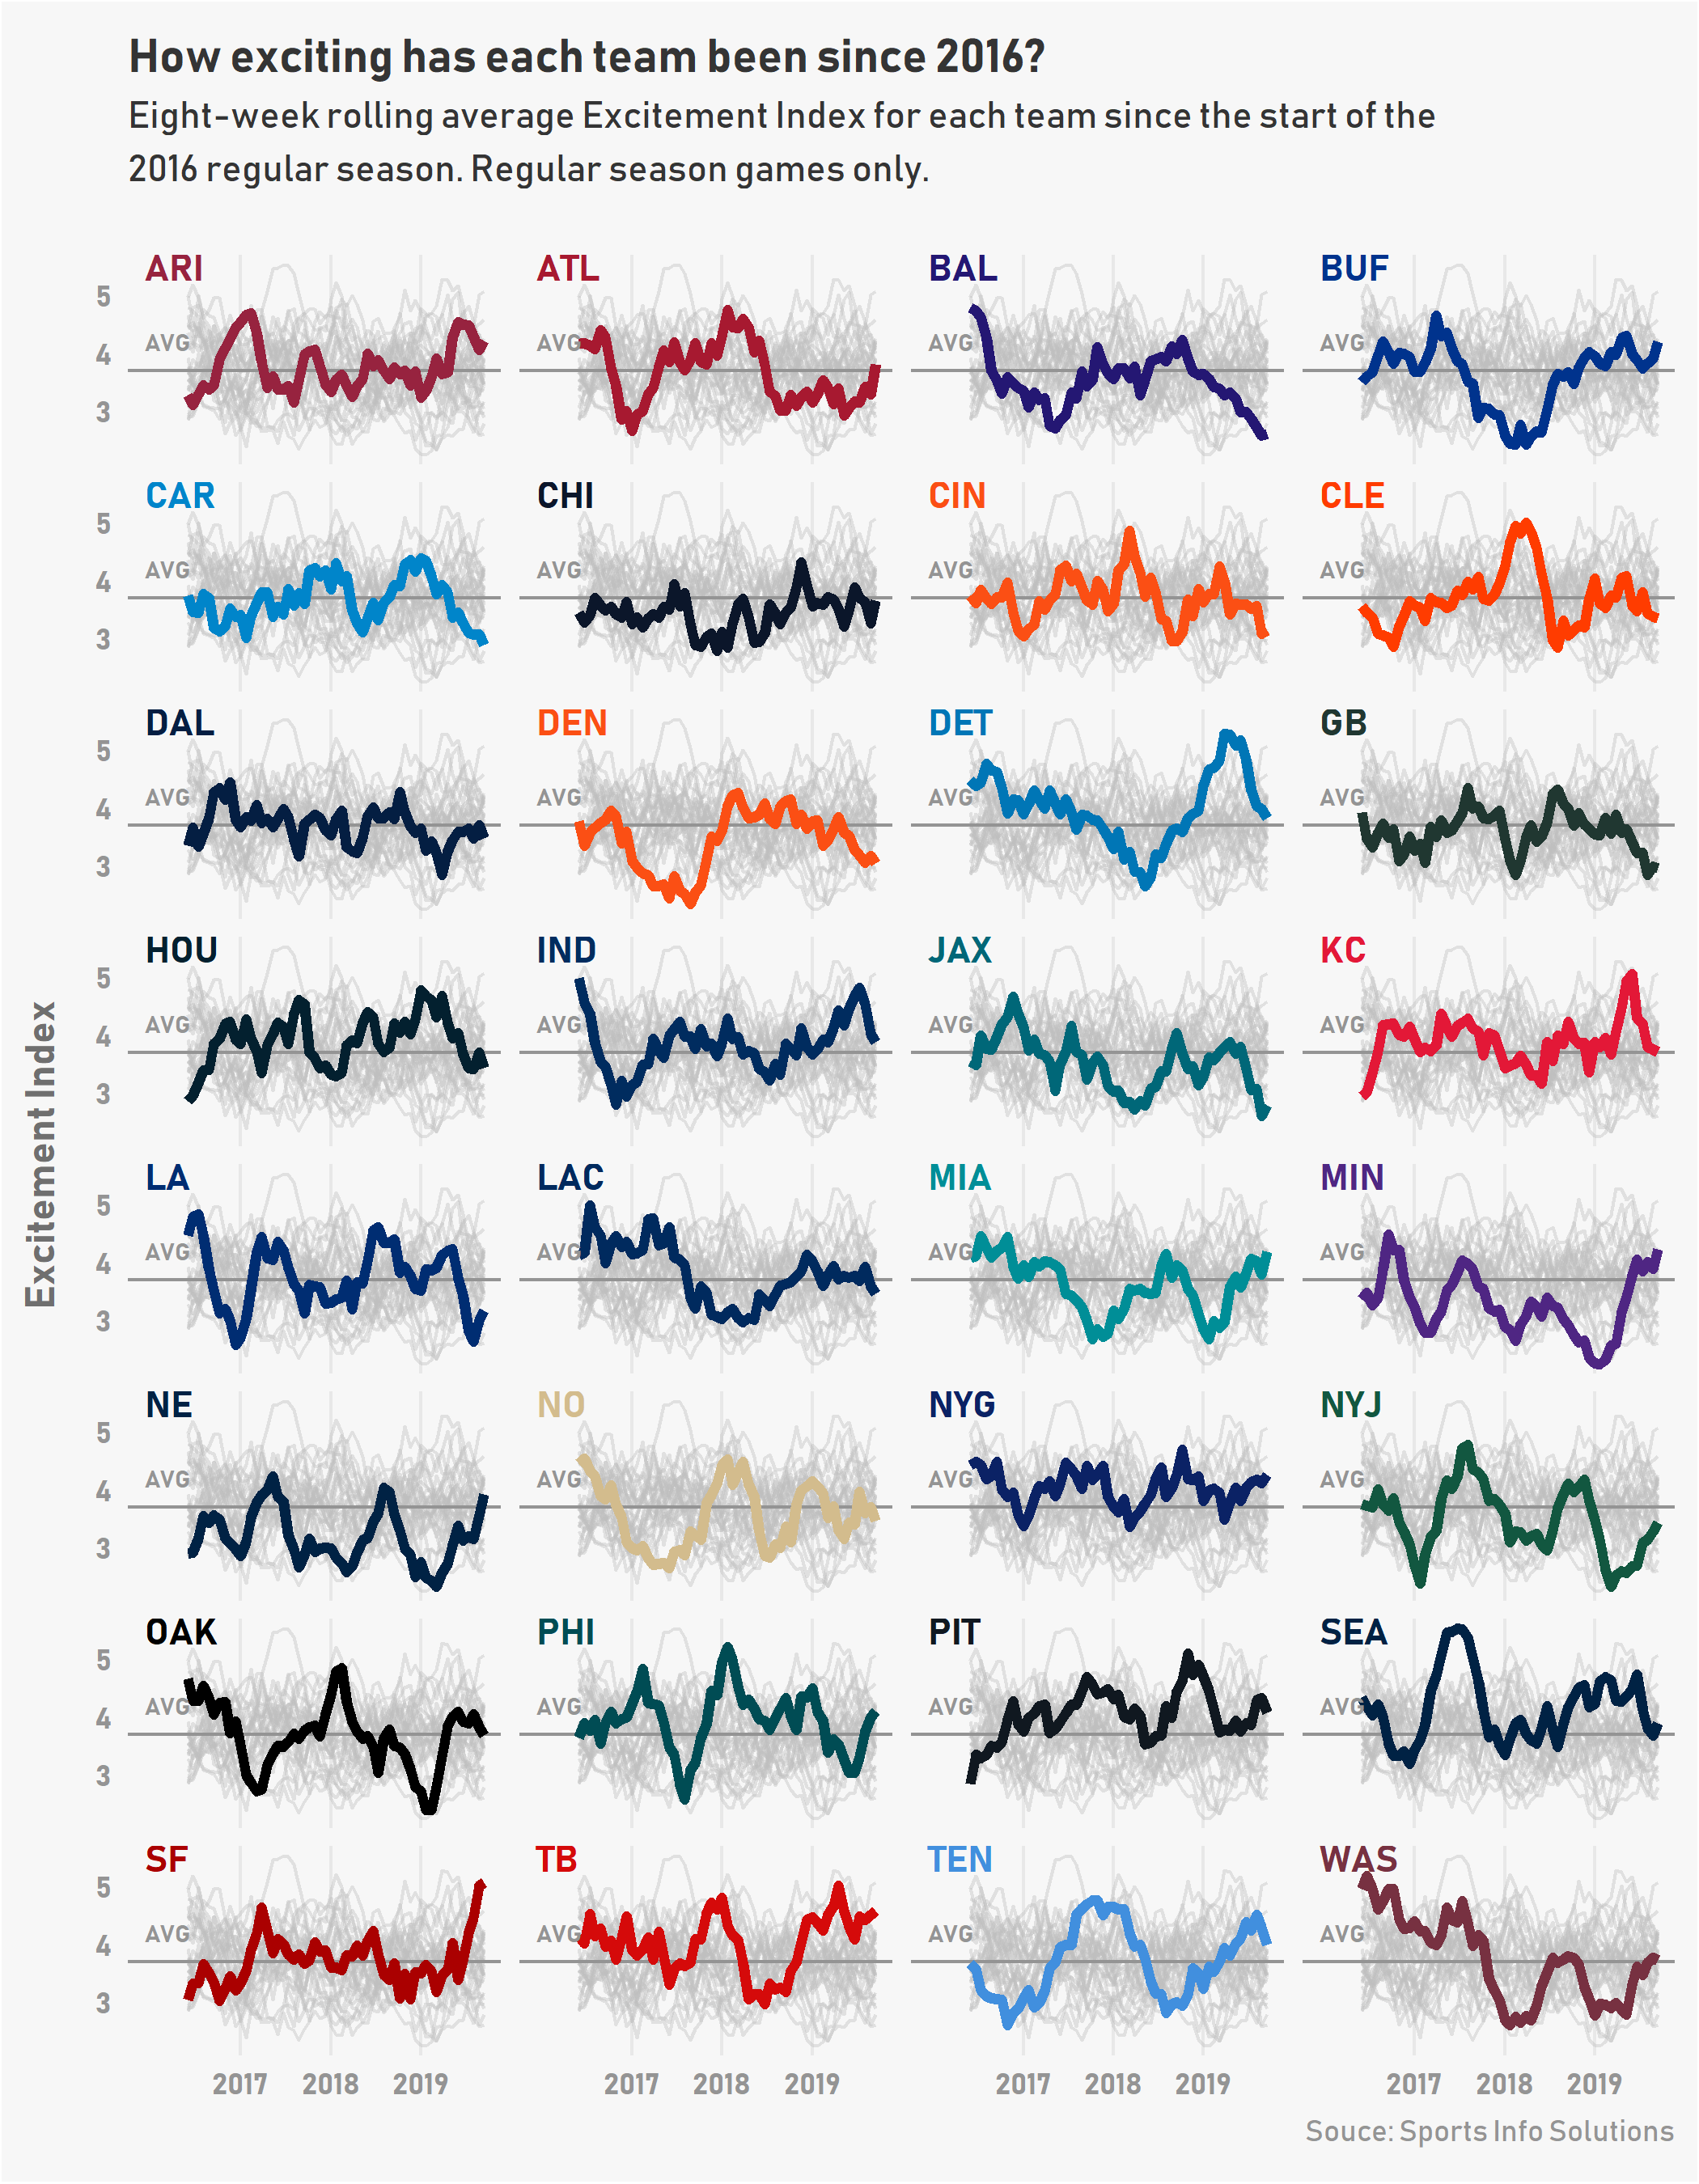
Which teams have given us the most exciting stretches of football?
By
Using Excitement Index to look at how teams made their fans nuts in the last 4 seasons.
-
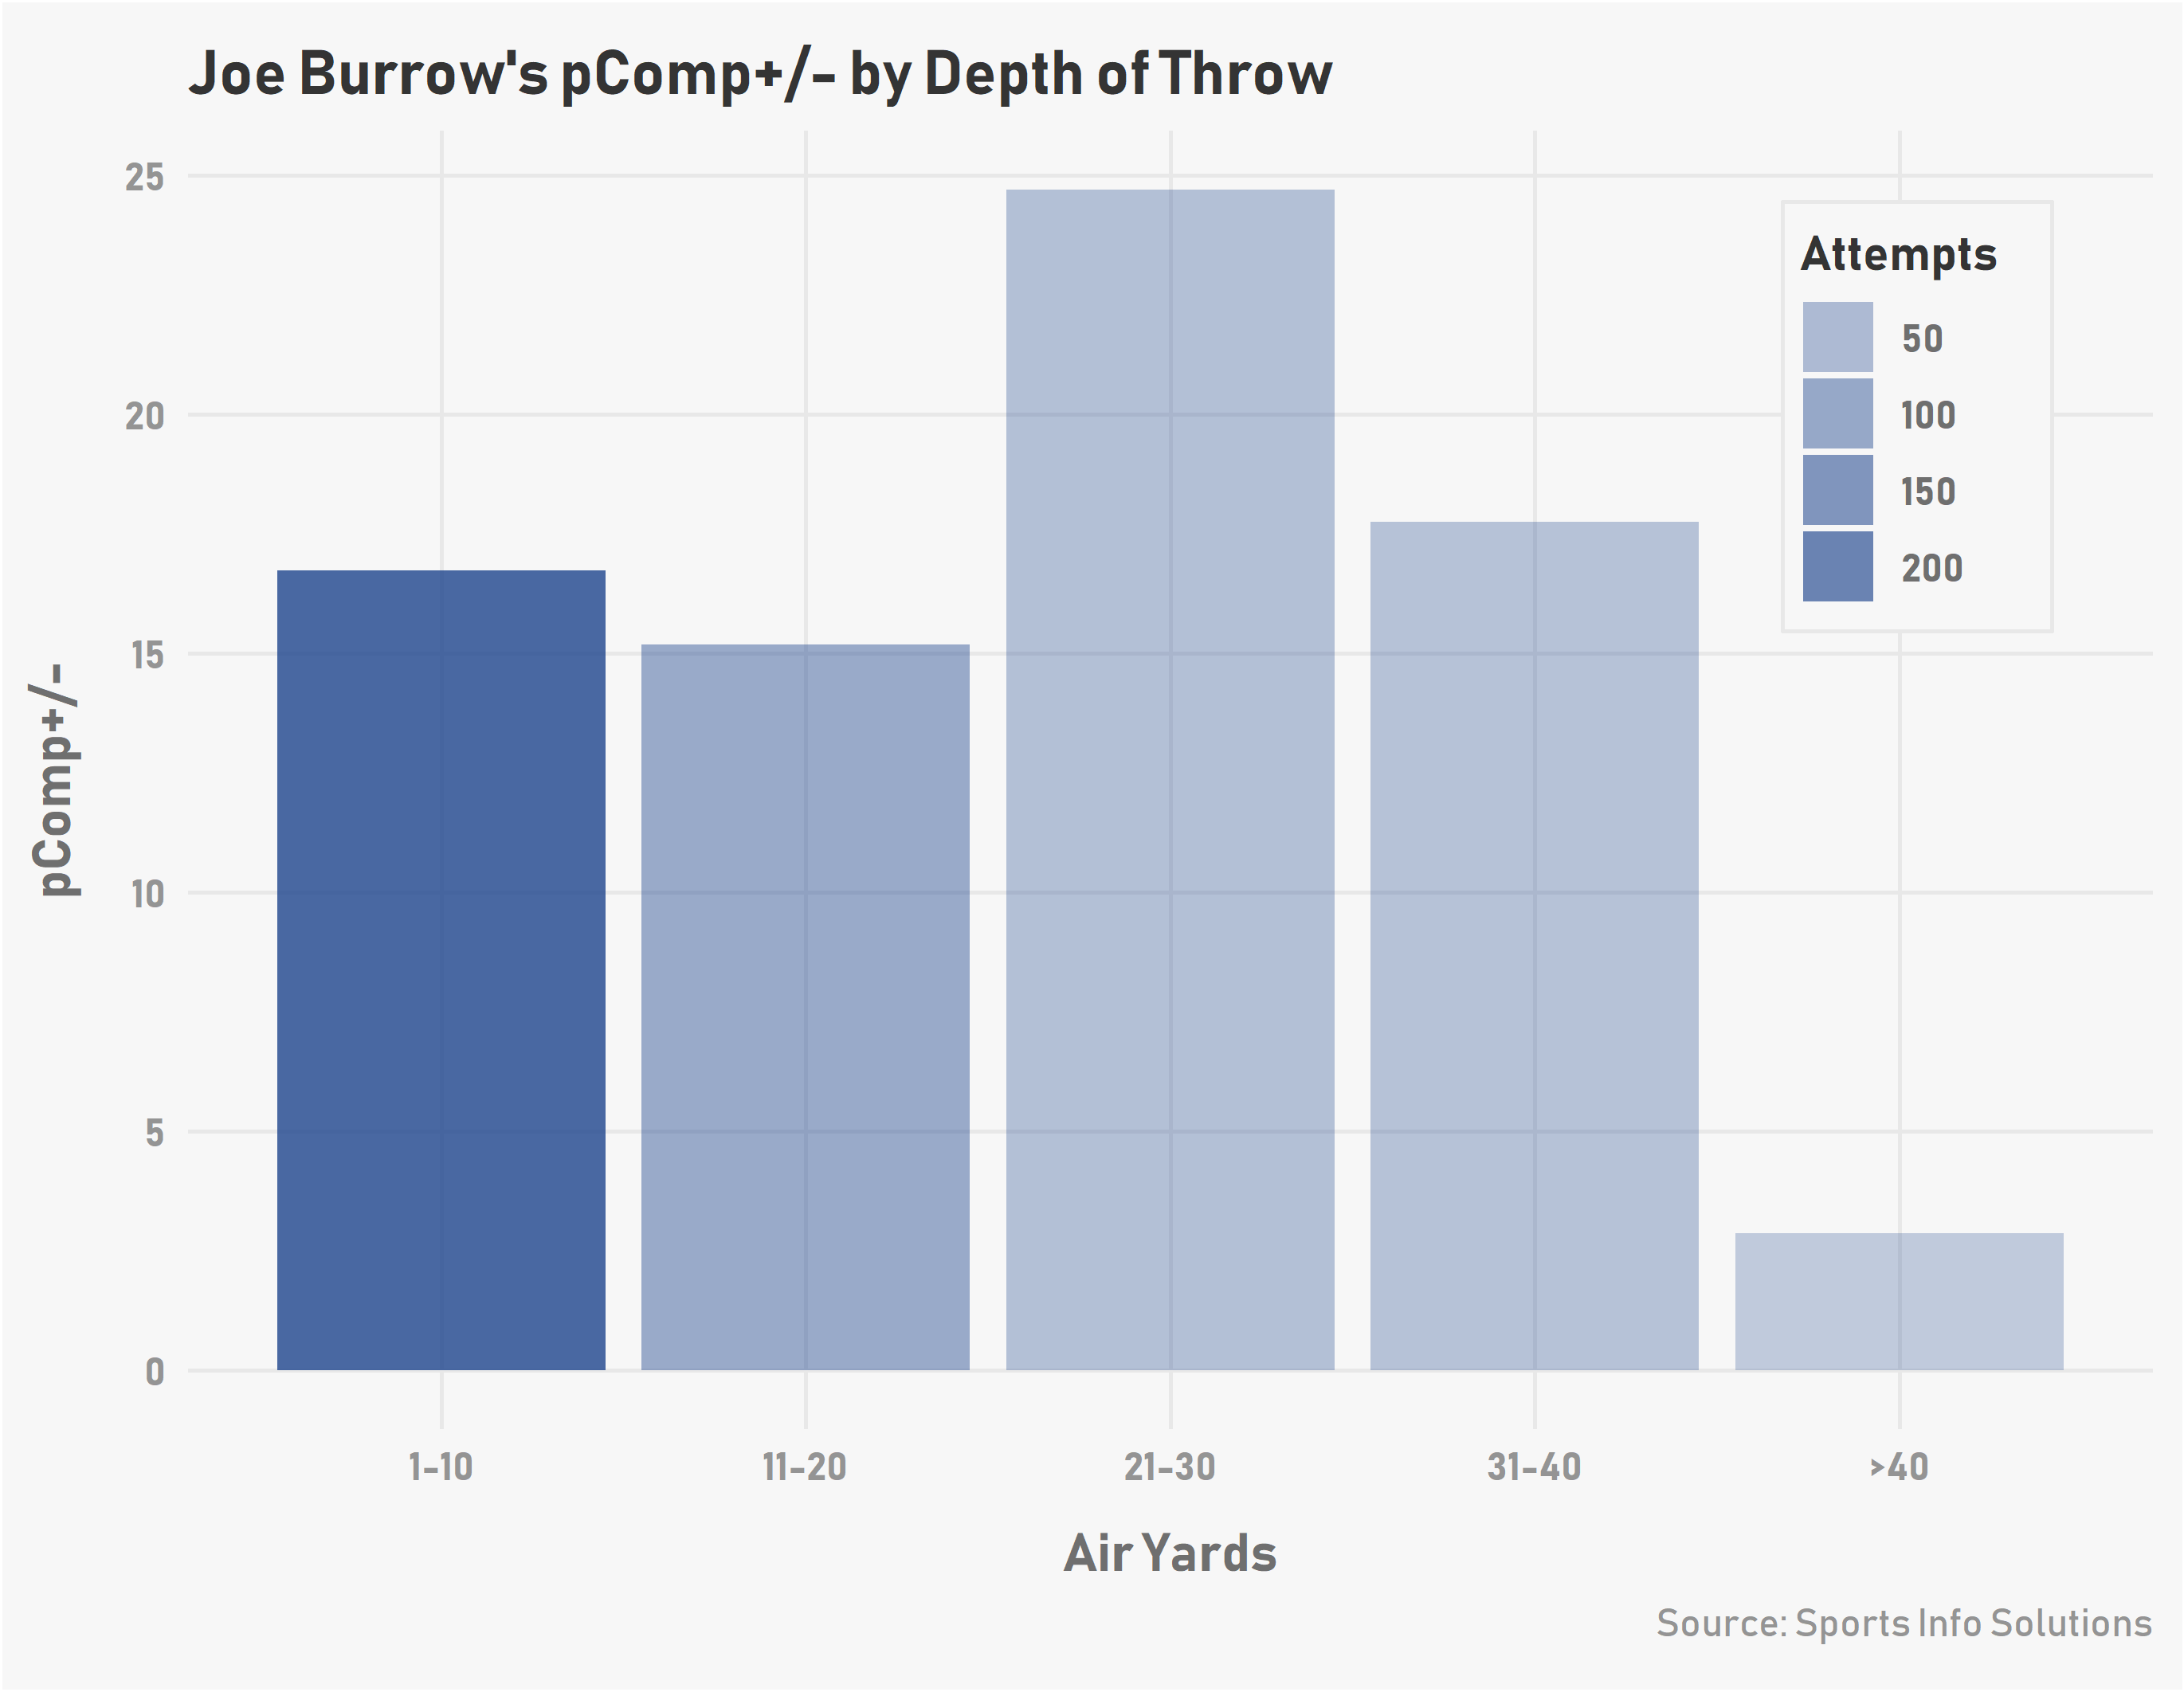
Evaluating Draft Prospects Using Predicted Completion Percentage
By
Taking a look at some top prospects in this year’s draft using two new metrics from SIS.
-
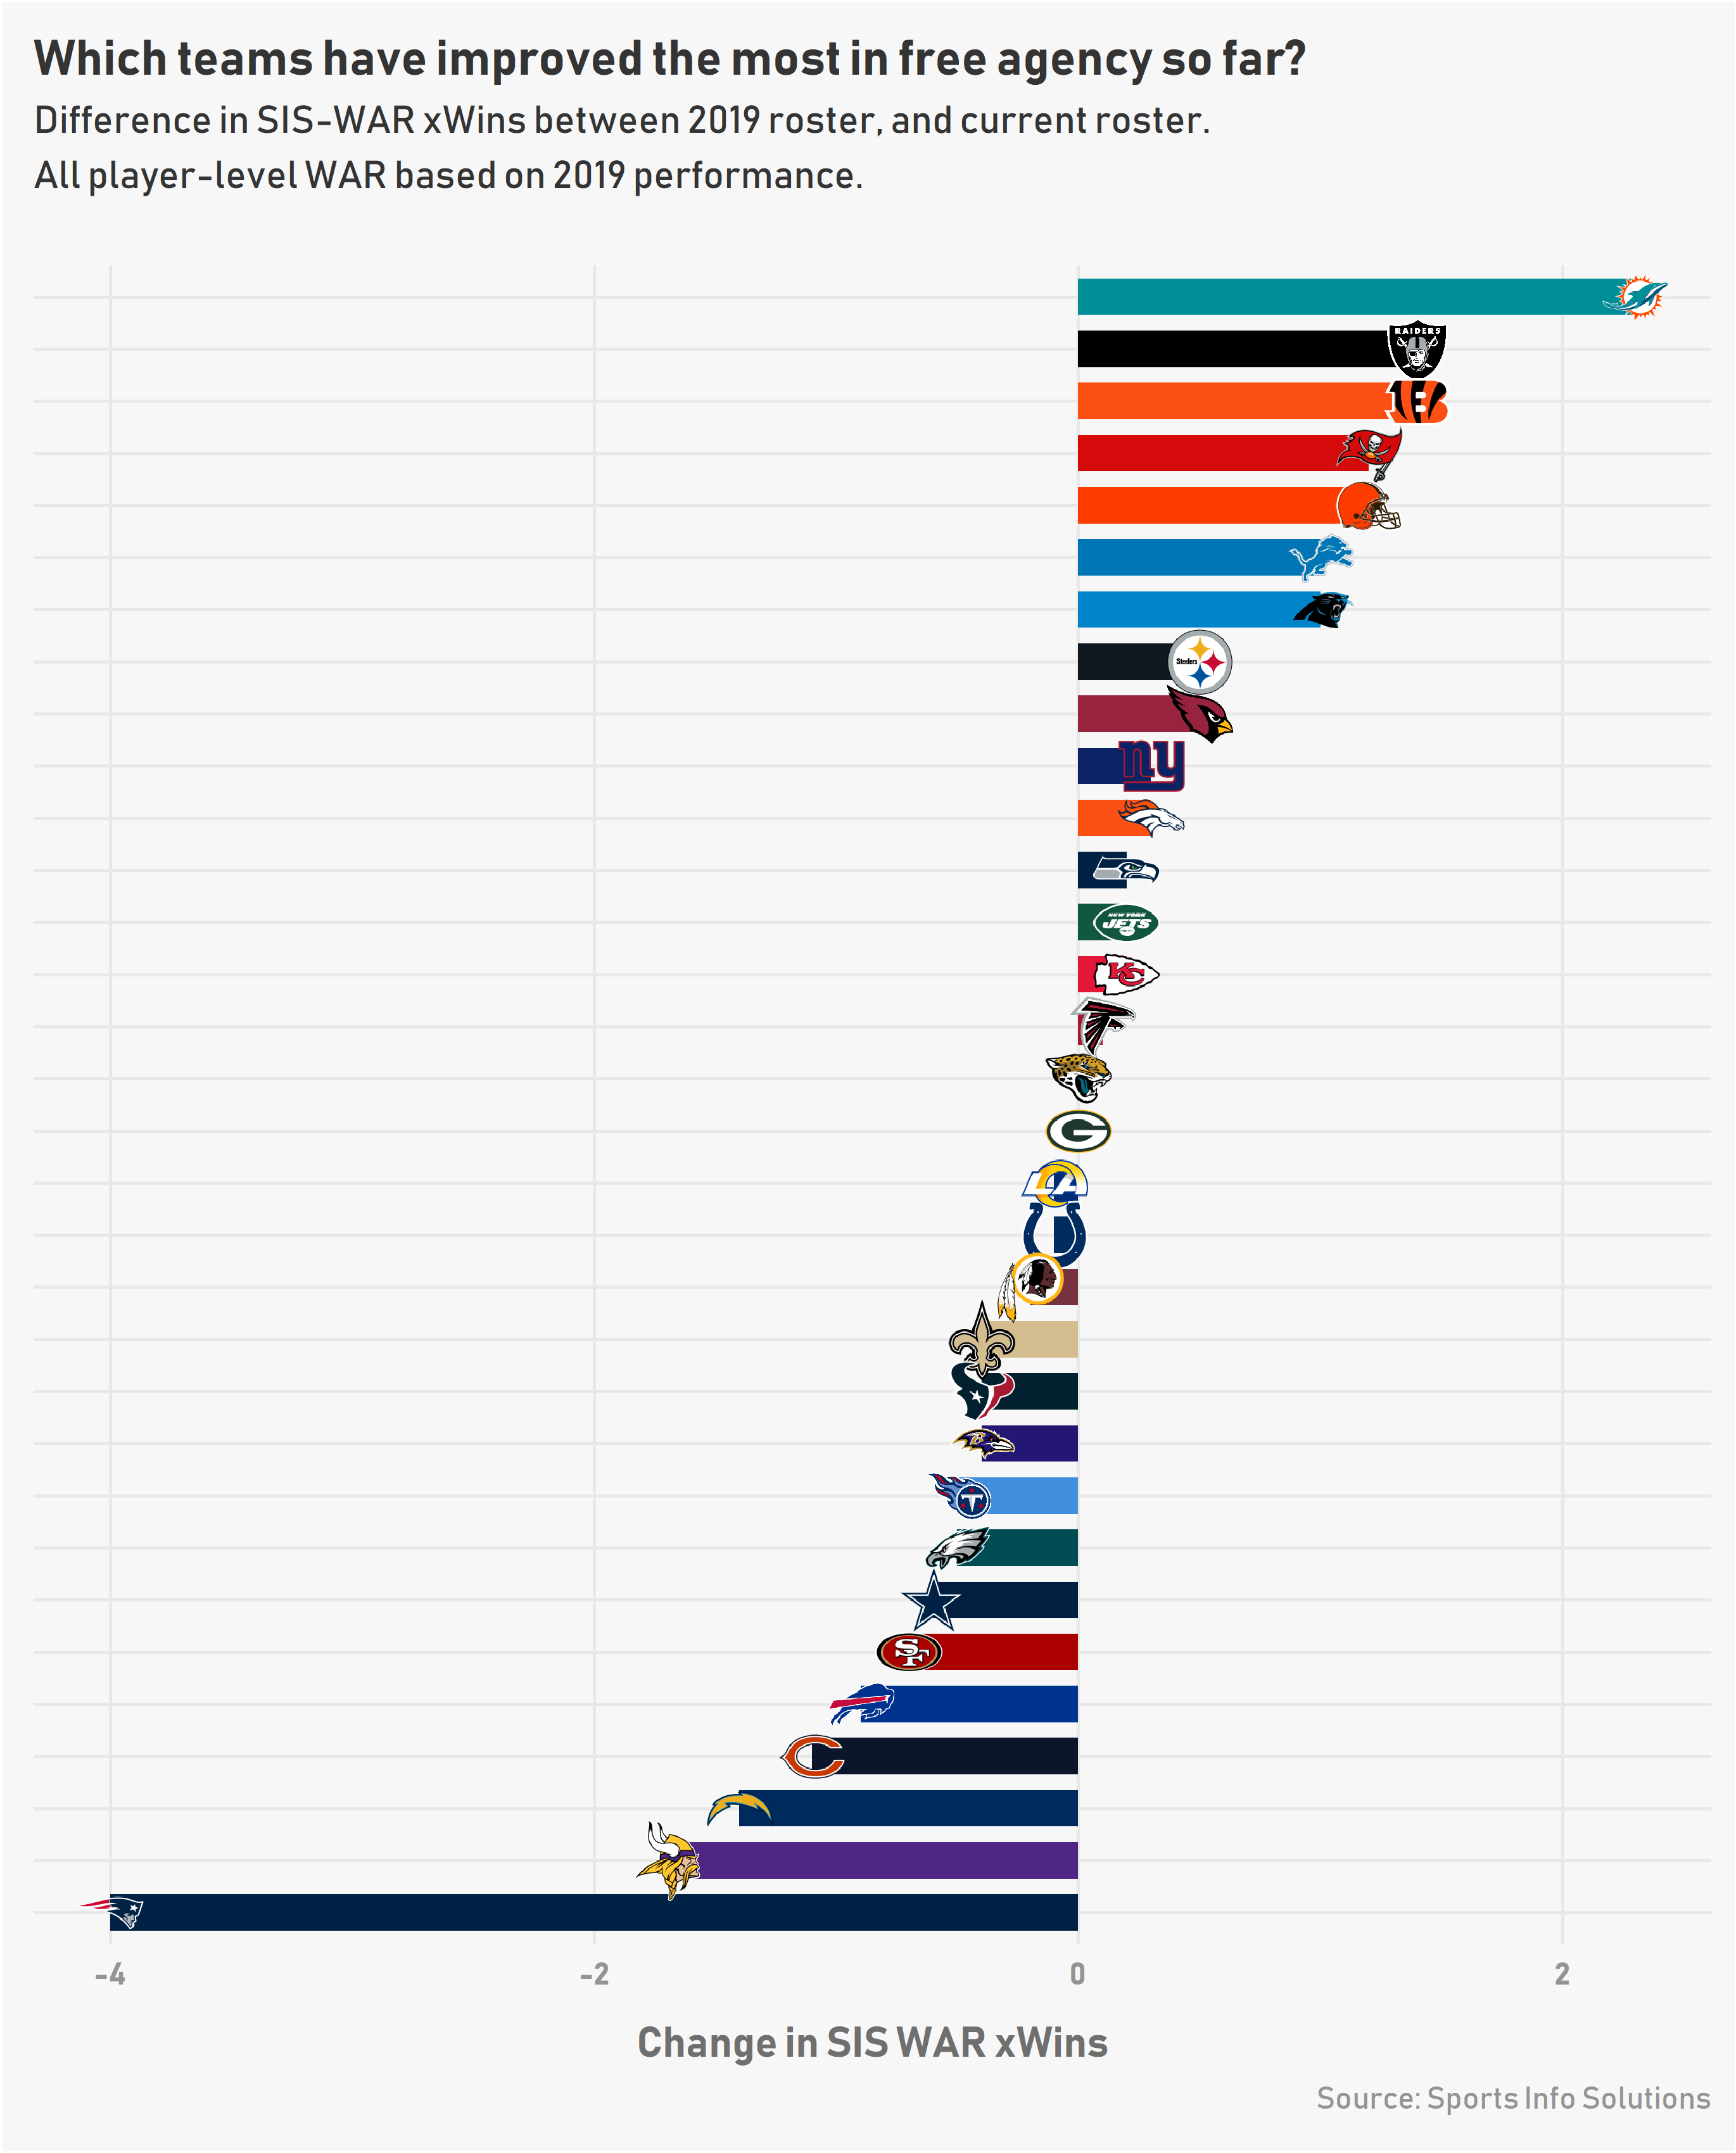
The Winners and Losers of the NFL Offseason… So Far
By
Based on SIS’s proprietary WAR metric, which teams have added or lost the most value so far this offseason?
-
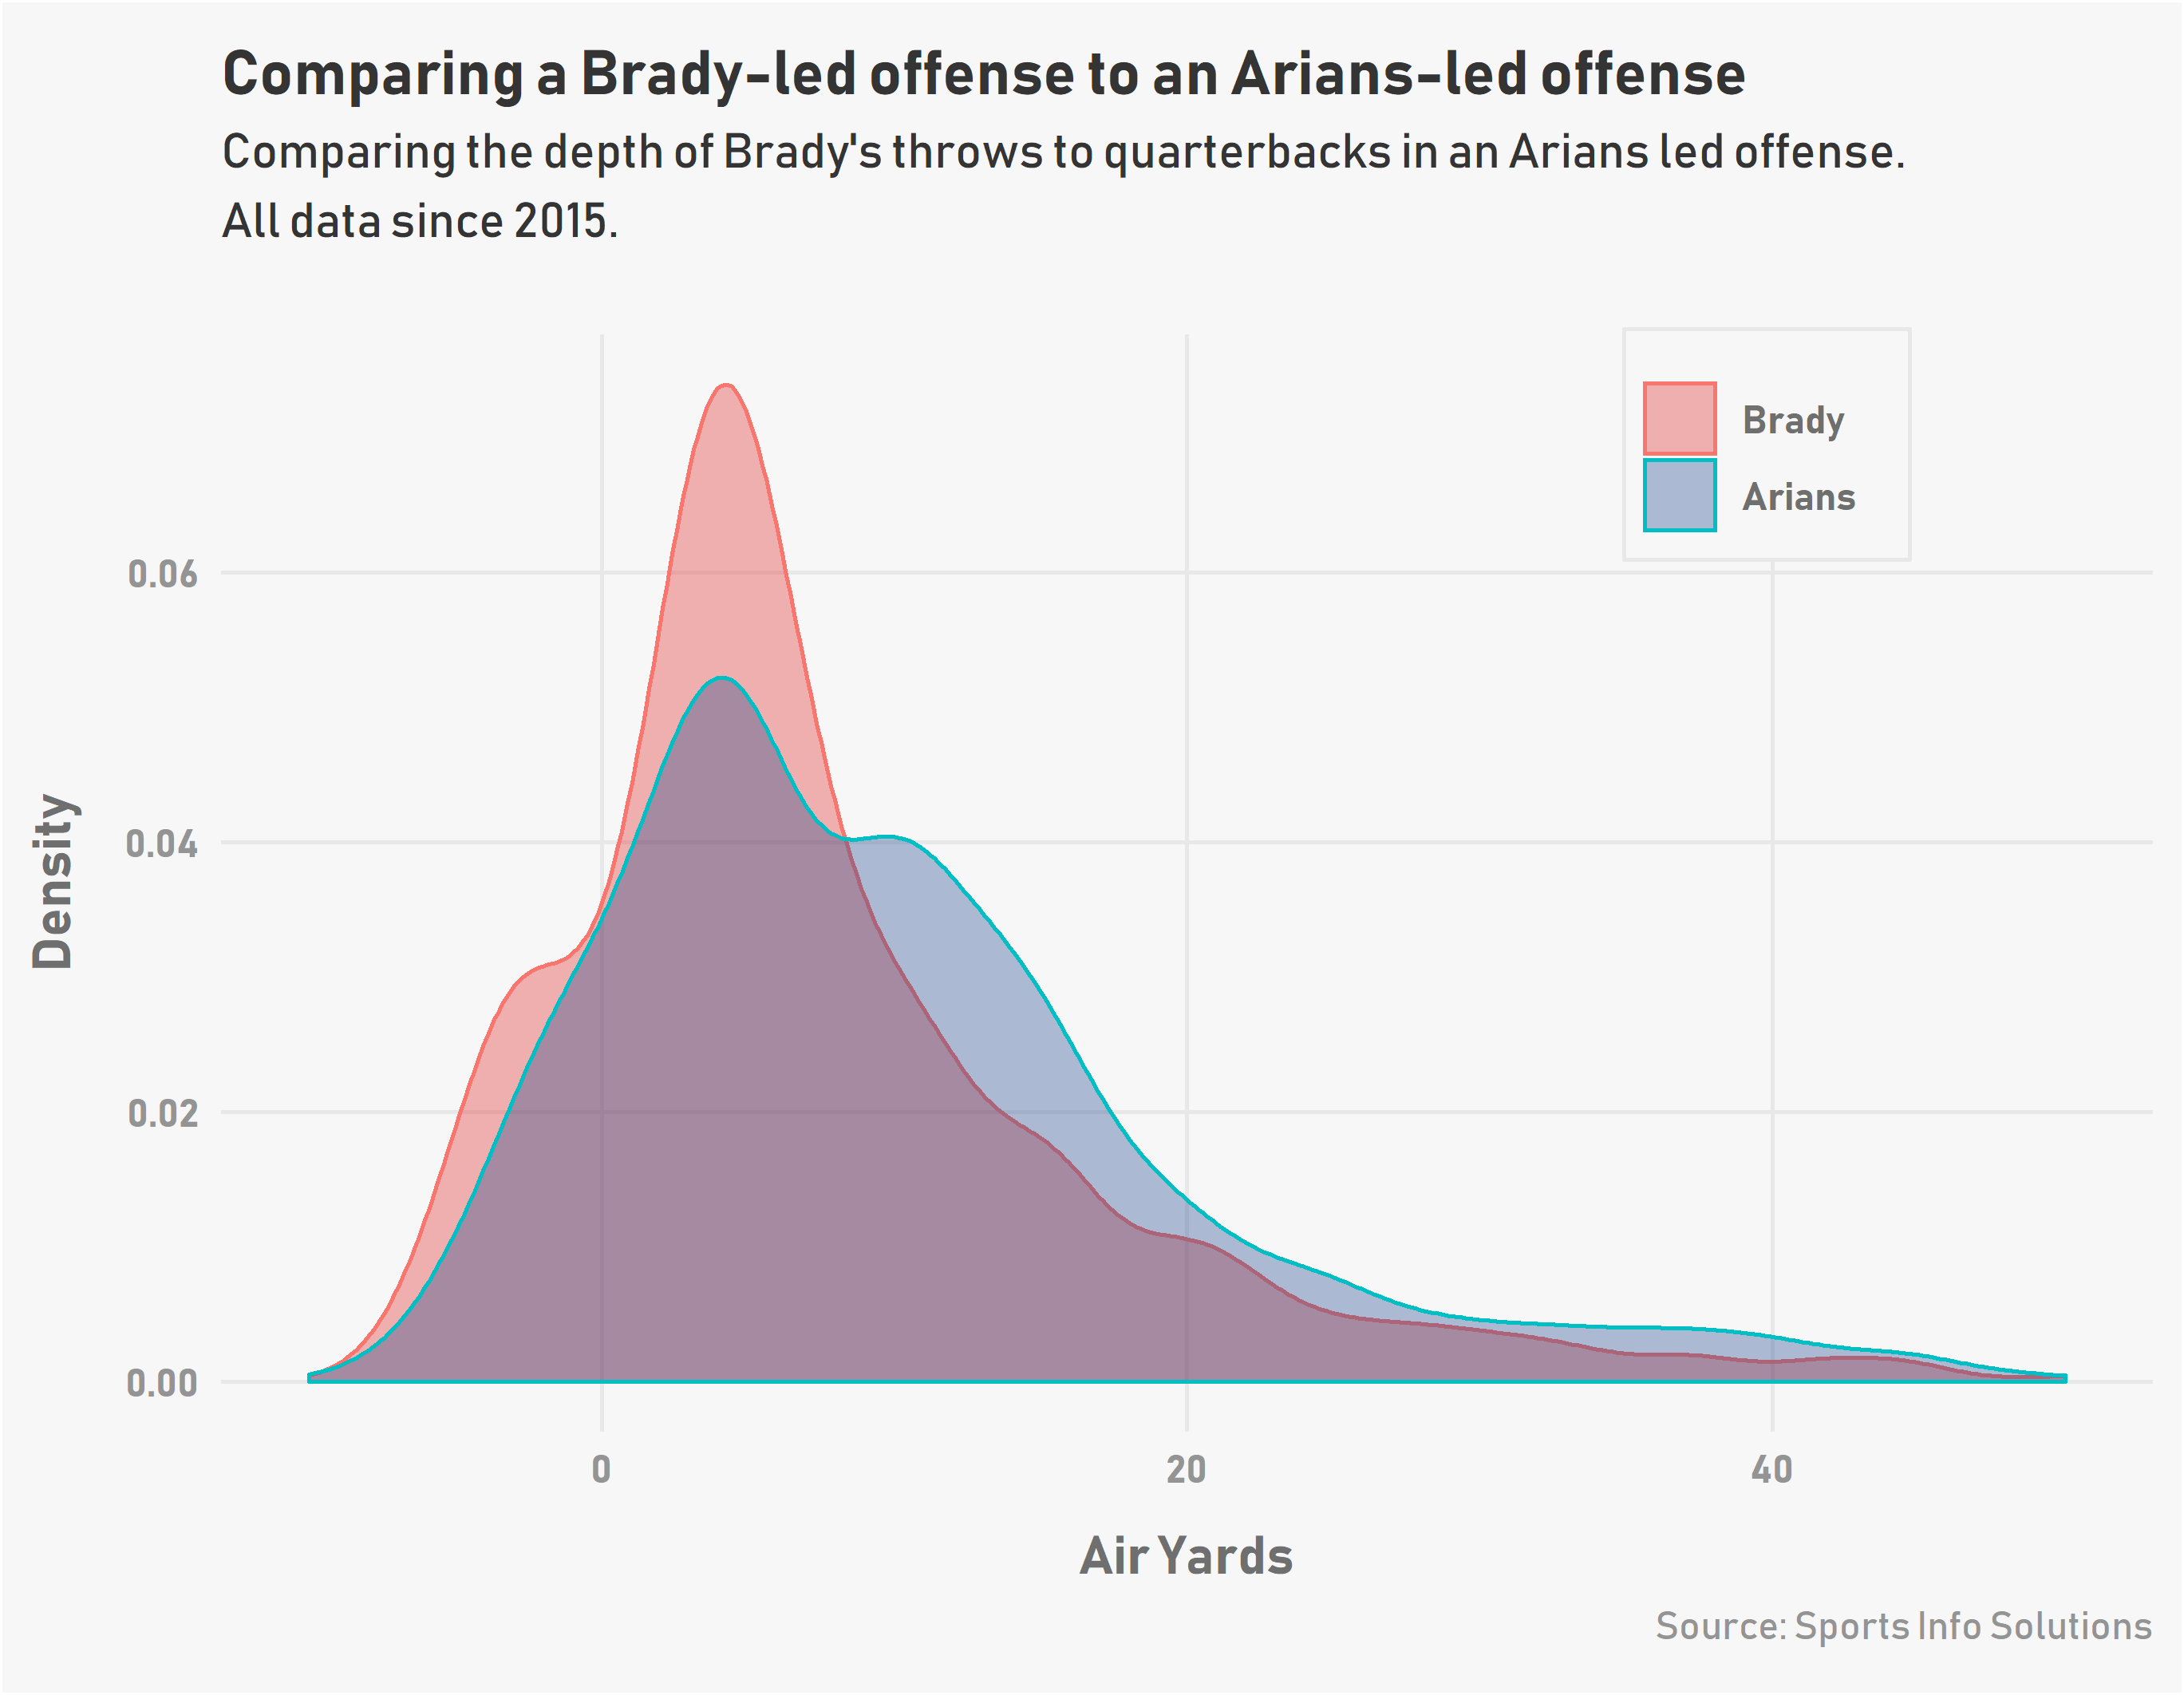
How does Tom Brady fit into a Bruce Arians offense?
By
Does Brady do the things that Bruce Arians likes?
-
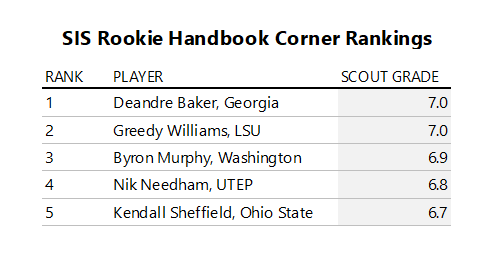
Two Highly Rated Prospects Have Seen Their Draft Stock Take a Hit: Here’s Why
By
Greedy Williams and N’Keal Harry have seen their stock take a hit leading up to the draft. We try and figure out why:
-
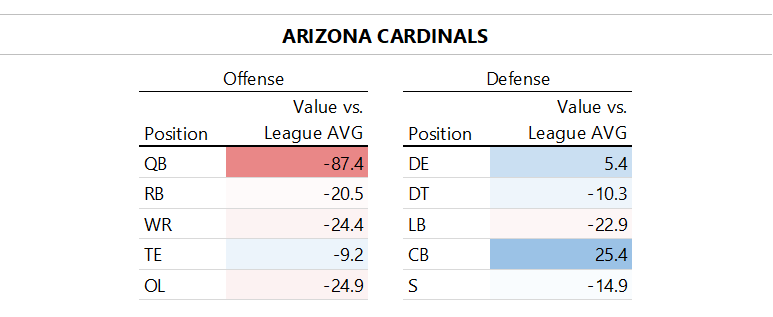
How Free Agency Might Impact the Top of This Year’s Draft
By
A deep dive into the offseason moves and potential future moves for the Cardinals, 49ers, Jets, Raiders and Buccaneers.
-
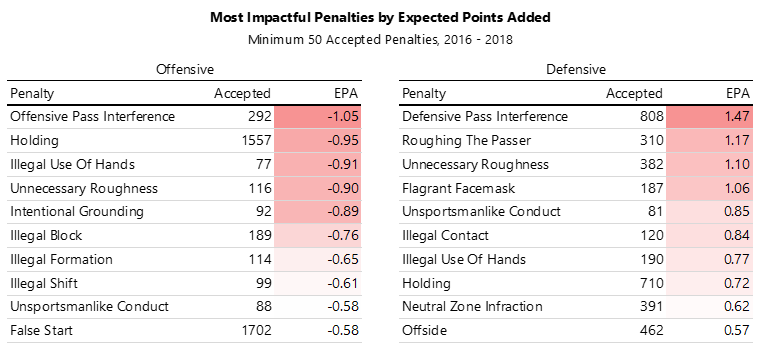
Quantifying the Impact of Penalties
By
With pass interference now a reviewable call, we looked at the impact of different penalty calls
-
Two Trades Overshadow an Eventful Start to Free Agency
By
Odell Beckham Jr. and Antonio Brown figure to make huge impacts with their new teams.
-
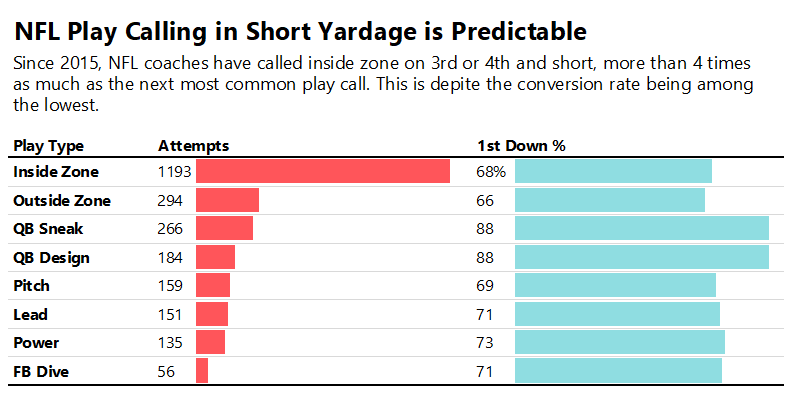
The QB Sneak is the most underutilized play in football
By
It doesn’t get any simpler than the QB sneak. It’s highly effective but not used enough.
-
Preview: AFC Championship – Patriots vs. Chiefs
By
On Sammy Watkins’ impact, the Patriots’ offensive line strength and more.