By Nate Weller
NextGen’s Completion Percentage Above Expected (CPOE) became one of the staple metrics for evaluating quarterback (and receiver and defensive back) performance this past NFL season. Due to its reliance on tracking data though, it was not able to evaluate NCAA players the same way. SIS’s two newest metrics—Predicted Completion Percentage (pComp) and Predicted Completion Percentage Plus/Minus (pComp+/-)—can add the same context to a player’s performance as CPOE, and can also be expanded into the NCAA ranks.
Evaluating Quarterbacks
A player’s pComp is calculated with SIS’s charting data. It uses route type, the defensive coverage, distance of throw, and whether or not the defensive line was able to generate pressure to determine how likely each pass was to be completed. pComp+/- is how much better or worse a player’s actual completion percentage was than what was predicted. Breaking down completion percentage in this way adds a lot of context to a player’s performance.
2019 pComp+/- Leaders – Quarterbacks (Minimum 250 attempts)
| Player | pComp | Actual | pComp+/- |
| Joe Burrow | 61.8% | 77.6% | 15.8 |
| Jalen Hurts | 60.2% | 71.7% | 11.5 |
| Tyler Huntley | 64.2% | 74.3% | 10.1 |
| Justin Fields | 59.9% | 70.0% | 10.1 |
| Kedon Slovis | 65.6% | 74.0% | 8.4 |
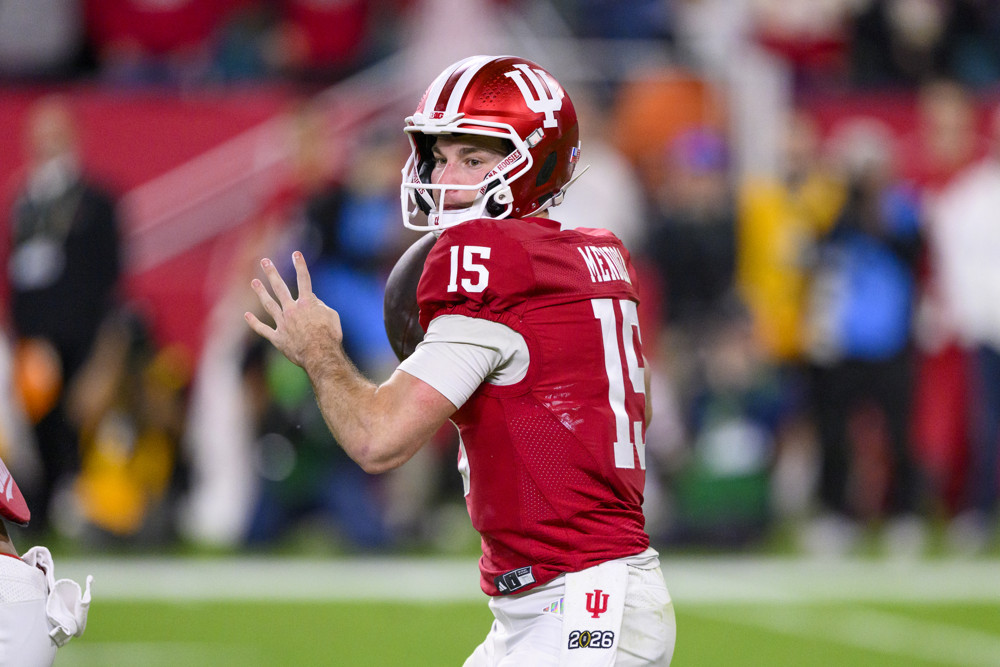
Not surprisingly, presumptive number one overall pick Joe Burrow tops the leaderboard by a fairly wide margin. Burrow also led the NCAA in SIS’s Total Value Metric, Total Points (his 251 was 71 more than the next closest player), and trailed only Tua in EPA per Attempt (EPA/A).
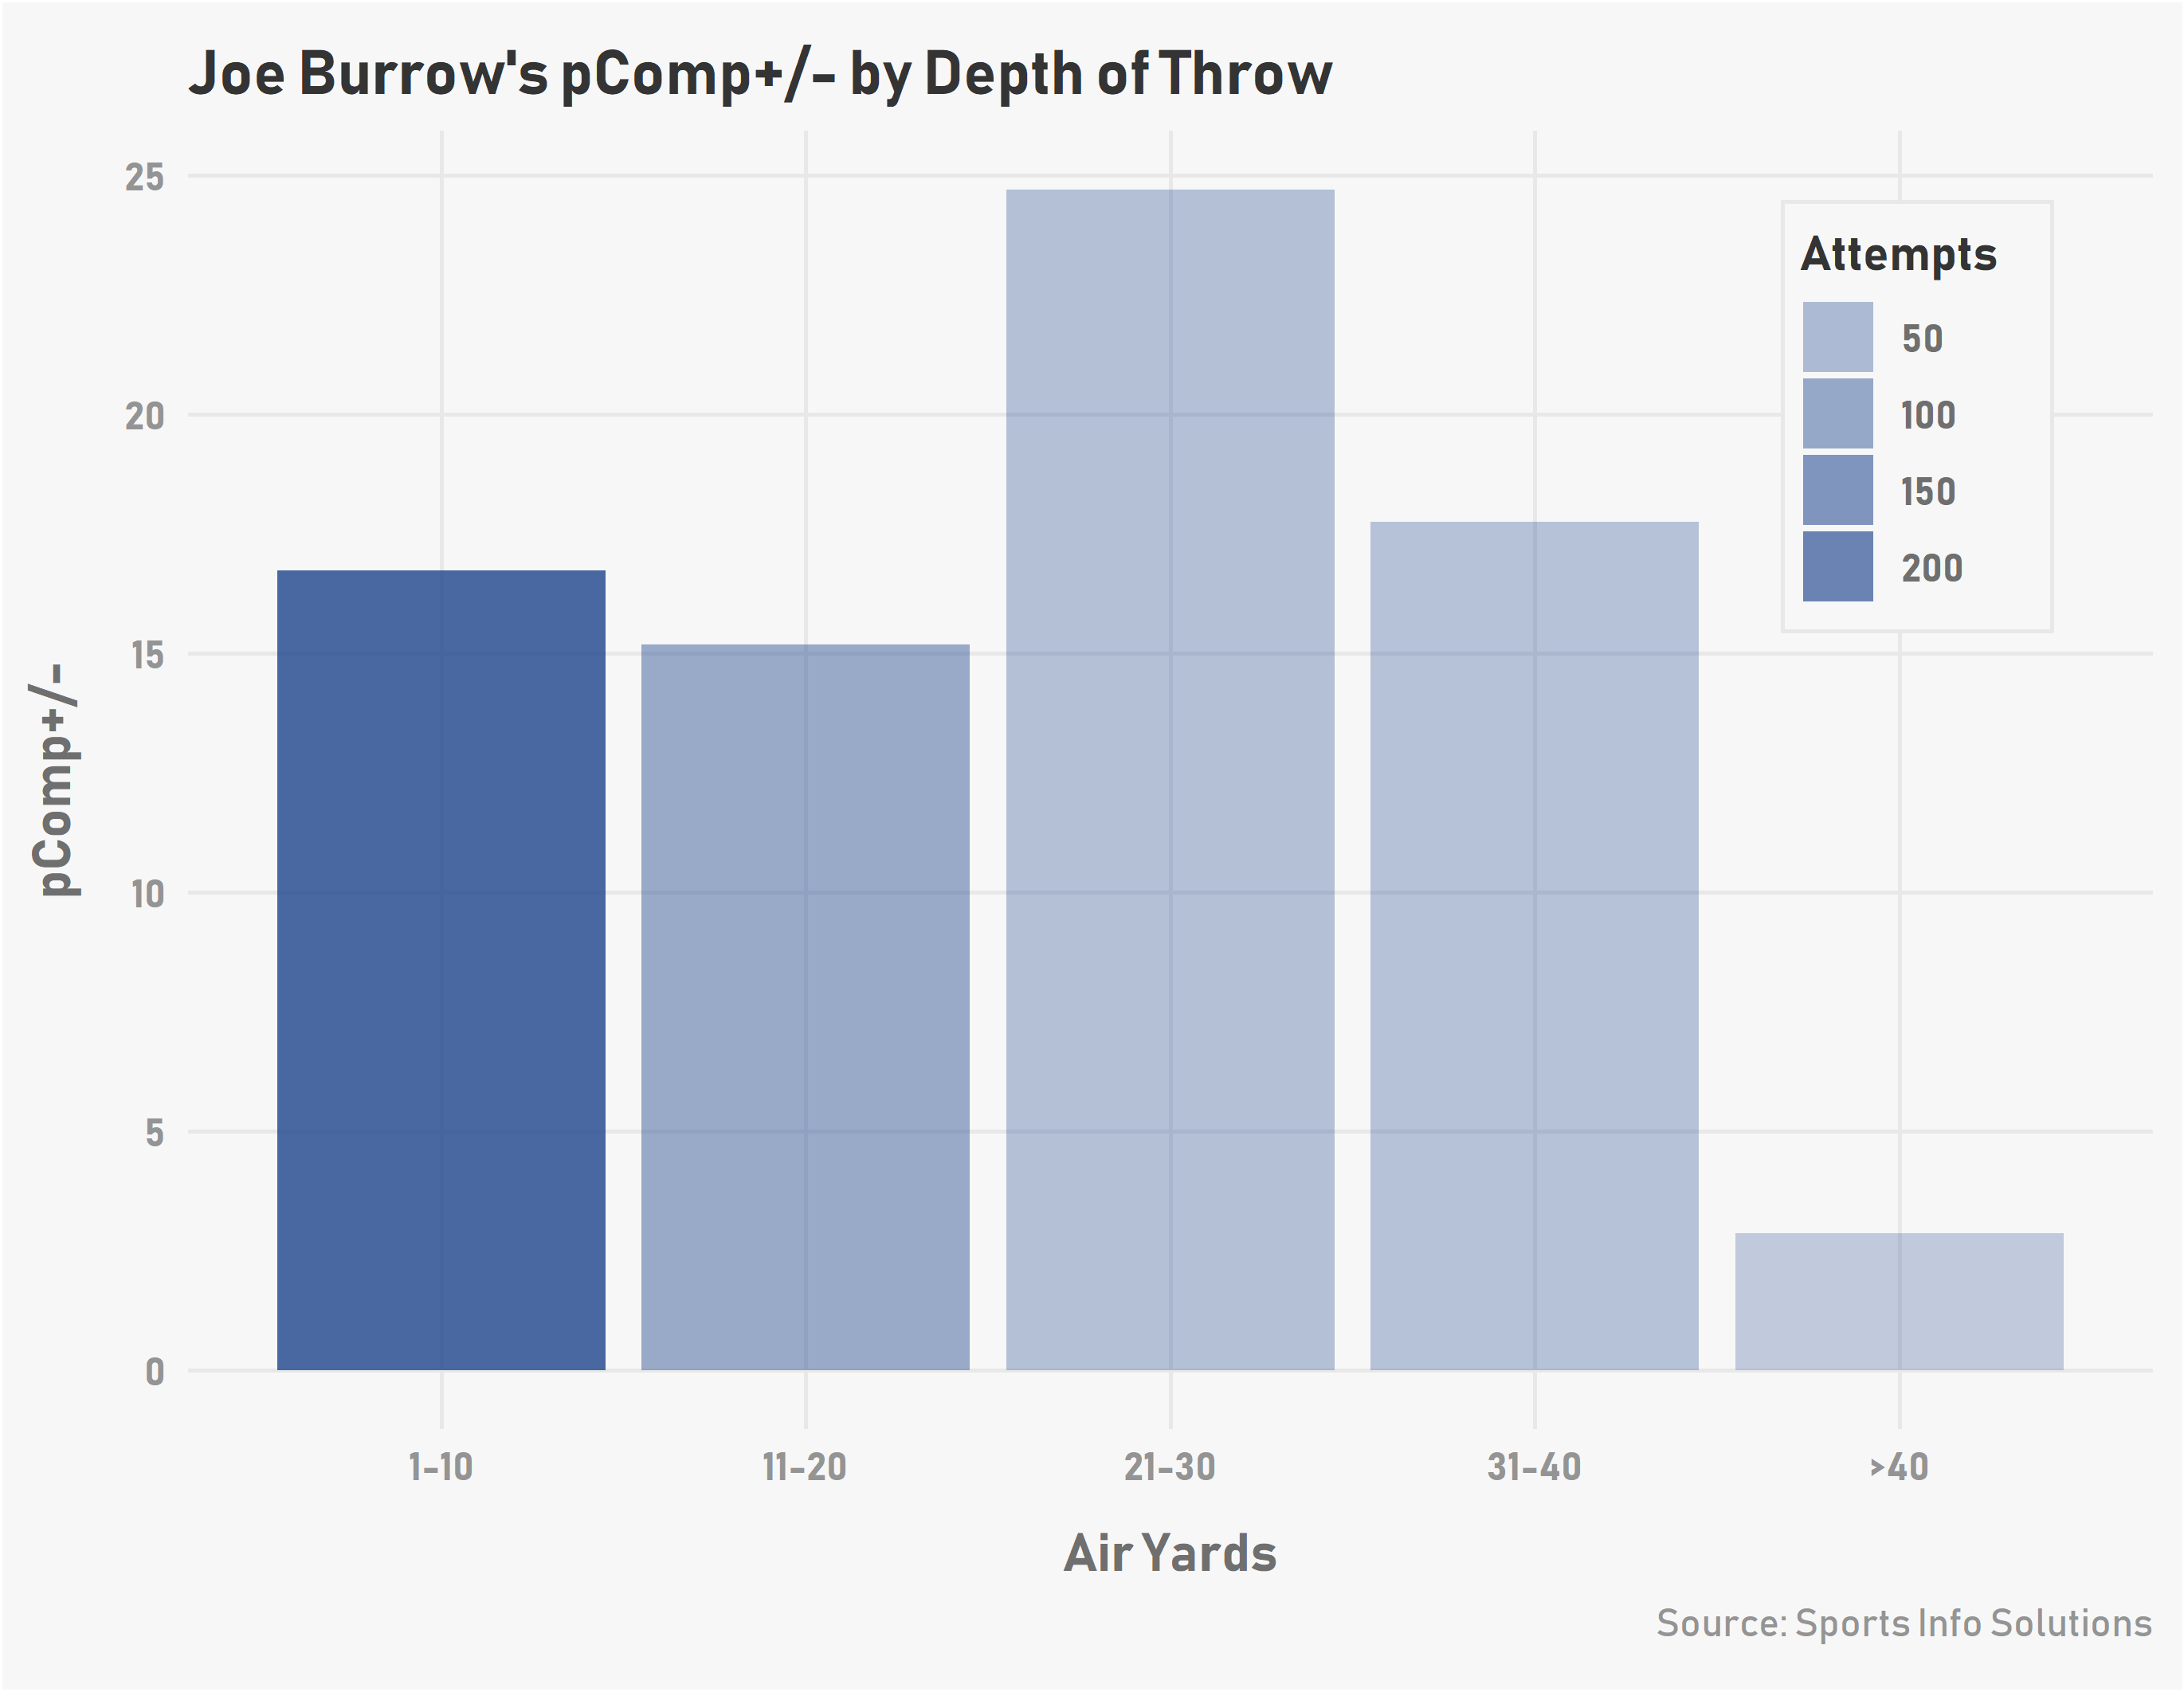
Burrow’s pComp+/- becomes more impressive when breaking it down by throw depth. Using buckets of five air yards, Burrow is actually at his best in the intermediate and deeper portions of the field. He posted a pComp+/- of 24.7 on throws between 21 and 30 air yards and 17.8 on throws between 31 and 40 air yards (he completed 14-of-29 but was expected to complete only 9 of those passes).
Another way to use pComp that has been popularized within the analytics “dark web” is to assess how many air yards a quarterback has completed above what would have been expected, or Air Yards Plus/Minus (AY+/-). As an example, a pass that travels 20 yards in the air with a pComp of 50% has an “expected air yards” of 10. A completion would net the quarterback +10, and an incompletion would be worth -10.
2019 AY+/- Leaders – Quarterbacks (Minimum 250 attempts)
| Player | ADoT | AY+/- |
| Joe Burrow | 9.1 | 1.6 |
| Tanner Morgan | 11.4 | 1.3 |
| Jalen Hurts | 10.6 | 1.2 |
| Layne Hatcher | 11.0 | 1.1 |
| Tyler Huntley | 8.5 | 1.1 |
Joe Burrow leads comfortably by this metric as well. On a per attempt basis, he completed 1.6 air yards above what would have been expected based on the difficulty of each throw. Jalen Hurts, who trailed only Burrow in pComp+/-, also cracks the top five here with an AY+/- of 1.2.
Evaluating Receivers
Predicted Completion Percentage can also be flipped on its head in a few different ways to evaluate receivers and defensive backs. For receivers, pComp+-/ is just the quarterbacks pComp+/- when targeting the receiver.
2019 pComp+/- Leaders – Wide Receivers (Minimum 100 targets)
| Player | pComp | Actual | pComp +/- |
| Justin Jefferson | 62.4% | 82.6% | 20.2 |
| Ja’Marr Chase | 53.8% | 68.0% | 14.2 |
| Easop Winston | 64.6% | 78.7% | 14.1 |
| Terrell Jana | 57.8% | 71.8% | 14.1 |
| Hasise Dubois | 57.6% | 71.4% | 13.8 |
Pacing all receivers in pComp+/- are LSU’s Ja’Marr Chase and Justin Jefferson. It’s hard to parse their performances from Burrow’s entirely, but there is still no denying that Chase and Jefferson are among the best in the country. Chase led the nation in both receiving yards and touchdowns and won the Biletnikoff Award as the county’s best receiver. Jefferson projects to be a late day one or early day two pick in the coming NFL draft.
Evaluating Corners
Flipping the metric again, we can look at which corners were the best at preventing completions as the primary defender. The metric is calculated the exact same way as it is for quarterbacks and receivers, meaning that a plus/minus below zero is good.
2019 pComp+/- Leaders – Corners (Minimum 40 targets)
| Player | pComp | Actual | pComp+/- |
| Caleb Farley | 48.1% | 27.9% | -20.2 |
| Trevon Diggs | 49.5% | 30.6% | -18.9 |
| Charles Oliver | 53.8% | 36.4% | -17.4 |
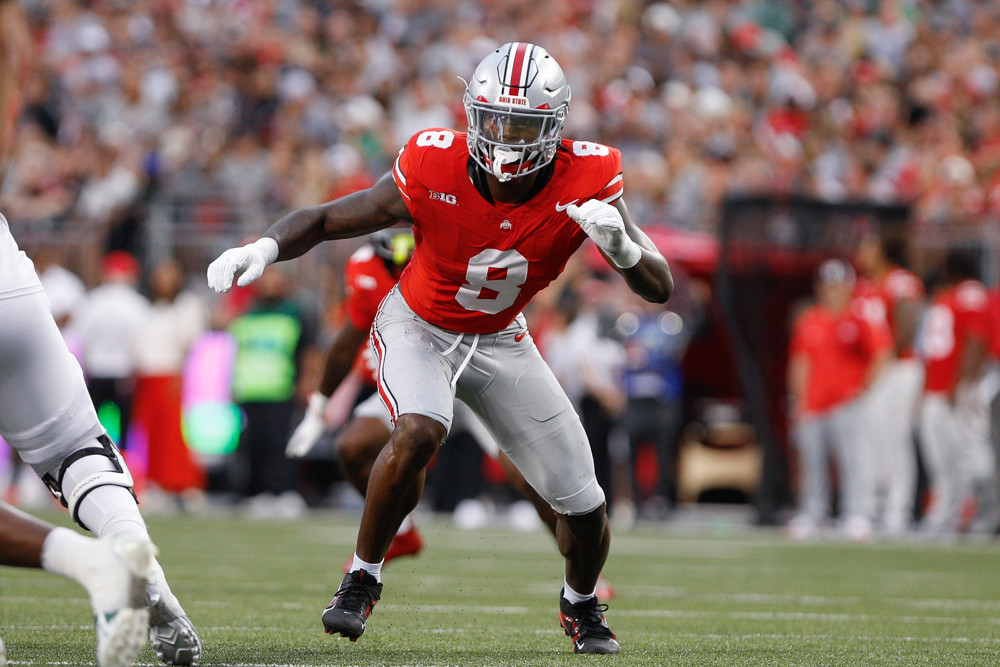
| Jeffrey Okudah | 56.3% | 39.6% | -16.7 |
| Parnell Motley | 51.5% | 36.2% | -15.3 |
Virginia Tech’s Caleb Farley was the best in the country by this metric. His actual completion percentage when targeted of 27.9% was 20.2 percentage points lower than what would’ve been expected. Trevon Diggs and potential top ten pick Jeffrey Okudah rank as the best among prospects who have entered the draft.