BY ALEX VIGDERMAN
This article is meant to be both an introduction and reference documentation for the “Above Replacement” stats added to the SIS DataHub Pro in April 2021.
They say, “the greatest ability is availability.” That may not be entirely true, but the saying does reflect the true idea that a player’s ability to stay on the field consistently over the course of a season and over many seasons is crucial. Being able to not only perform better than one’s peers but to do so over a large sample makes a player truly valuable. Even being an average player over time has value because the alternative is to use a below-average player—in short, Efficiency x Volume = Value.
In baseball, the Wins Above Replacement (WAR) statistic was created to measure a player’s ability to accumulate value relative to his peers, both by playing consistently and being consistently better than some benchmark. With WAR, the benchmark is a “replacement” player, conceptually one who can be easily acquired in free agency or promoted from the minor leagues (or from the practice squad in the case of football).
Comparing to replacement level means that a player is valued relative to the easily-obtainable alternatives a team might have. That benchmark is, of course, different for different positions, as it’s more difficult to play certain positions competently than others. We would expect an average quarterback to be more valuable to a team than an average running back.
Embracing the WAR concept in football, Sports Info Solutions has its own WAR metric, using concepts coming from baseball’s implementation (at Fangraphs and Baseball Reference specifically) as well as previous attempts in football by groups like Yurko et al. The metric builds off the structure created by SIS’s Total Points system—specifically, Points Above Average, or PAA—by adding two layers of computation on top of it: the comparison to the PAA of a replacement-level player, and a Points-to-Wins conversion that puts player contributions on the scale of team wins.

These WAR values (and the underlying Points Above Replacement, or PAR) are available on the SIS DataHub Pro in all the same places that you’d find Total Points, with all the same ability to filter and sort the results. These numbers are only available to SIS DataHub Pro subscribers and will not be made available on the free version of the DataHub.
What’s the difference between Points Above Replacement and Total Points?
In most cases, these metrics will tell you similar things. They both aim to express a player’s value in terms of points to his team, and so they’re roughly on the same scale, and both have Points Above Average as their basis.
The key reason to consider using PAR (and correspondingly WAR) instead of Total Points is that there is a specific notion of the relative value of different positions and facets of the game. Total Points draws a distinction between quarterbacks and everyone else, but it does not make any distinction between the value gained by a guard run blocking and that of a wide receiver in the passing game. In reality, the former is less valuable than the latter, but because the extent of that difference is relatively small you can consider Total Points to be a reasonable facsimile of Points Above Replacement.
Methodology
Determining Replacement Level
What makes a player “above replacement”?
It could be taken in a few different conceptual directions. One option is to consider replacement level as the performance of backups, and another is the performance of players who are only on a roster part of the time. However, the latter group can be quite hard to measure because you need enough play data to evaluate those players accurately.
SIS has chosen to use playing time in the first 15 offensive or defensive plays of a game as the determinant. The 15-play threshold was chosen to align with a “scripted play” structure that comes from Bill Walsh’s game-calling strategy. This makes it so that players who regularly fail to make it onto the field when the team’s plans are still in place are essentially considered backups or easily-replaced players.
Specifically, players who appeared in the first fifteen snaps for either side in at least half of the games and at least a quarter of the total snaps in a given season are considered above replacement level, and any player who fails to qualify for that standard is “replacement level” (or below). This line for replacement level is a bit higher than might be ideal, but we can’t measure the performance of players who don’t make it onto the field, so this serves as a viable delineation.
Steps Used to Determine Replacement Level Performance
- Start with only the first 15 offensive plays and defensive plays of each game of the last three years (and all special teams plays, for kickers and punters)
- For each season, identify the players who did not appear in enough games or enough plays to qualify as at least rotational players.
- Offense/Defense: at least half the games and at least a quarter of snaps
- Kickers/Punters: at least half the games and at least 15 kick events
- This list of limited-playing-time players could also include starters who missed substantial time to injury. That’s an unfortunate side-effect of this method. The effect of this is tempered by our using three years’ worth of data to inform our replacement level estimates, so a starting-level player who gets injured one year will still primarily be considered a starter.
- Replacement level performance is taken as the average per-play Points Above Average among “replacement level” players for each combination of position and facet of the game (e.g., running back receiving, offensive tackle run blocking, safety pass rushing)
This replacement-level definition isn’t used directly for those players’ WAR, because it doesn’t take into account their performance on those plays. After all, a player who was considered a backup by this standard could perform so well in a small sample that he ends up above zero WAR.
But the average performance of these backup-level players is used as the value standard for a replacement-level player. That standard leaves us with, for example, 32 quarterbacks, 109 wide receivers, 84 defensive tackles, and 107 cornerbacks who are considered at least rotational players, and everyone else is included in the determination of replacement level.
Within that pool of “replacement level” players, the average per-play performance is calculated for every combination of position and facet of the game. Those values are taken as the average Points Above Average for the group of “replacement level” players within each position-phase combination. A player’s Points Above Replacement is just his Points Above Average in a given facet minus his position’s replacement-level Points Above Average in that facet.
In general, when a skill has a low replacement level, it means that there’s a wide gap between the best and worst players, and therefore that skill is valuable. To illustrate how that works out in terms of positional value, here are the common position-phase combinations with the most and least average value relative to replacement level for the 2018-2020 seasons.
Most and Least Valuable Skills by SIS WAR, 2018-20
| Rank | Highest Average WAR | Rank | Lowest Average WAR |
|---|---|---|---|
| 1 | Quarterback Passing | 1 | Defensive Tackle Pass Rush |
| 2 | Running Back Rushing | 2 | Center Run Blocking |
| 3 | Wide Receiver Receiving | 3 | Cornerback Pass Rush |
| 4 | Cornerback Pass Coverage | 4 | Linebacker Run Defense |
| 5 | Tight End Receiving | 5 | Defensive End Run Defense |
The biggest thing that pops out here—aside from the fact that Aaron Donald is single-handedly holding up the value of defensive tackles—is that running backs might matter after all, as they show up second on the list.
While it is true that rushing performance is relatively valuable, RB rushing is closer in average value to the bottom of this list than the top. You can consider passing in one category and everything else in another, although there is still room to distinguish among the rest.
Beyond that, the Total Points system gives backs more credit than other EPA-based systems because it makes an adjustment to each player on each play based on the likely EPA gain or loss on the play given the call (pass or run) and situation. While most 3rd-and-8 runs are dead in the water, it’s not held against the offensive players that such a call was made. This makes running backs in general more able to gain and lose value than you might think given how EPA on run plays tends to look.
One last point is that we selectively remember the replacements who do well. We hold up players like Tony Pollard, Alexander Mattison, and Austin Ekeler as examples of replacements who can perform comparably to their better-compensated teammates. The counter to that is there are just as many examples of players who are given brief opportunities and squander it. And because running backs can really mess things up with a poorly-timed fumble, players like Jeremy McNichols and C.J. Prosise counterbalance the strong performances of the names above.
Converting from Points to Wins
The conversion from points into wins is to some extent a rough estimate, because it doesn’t take into account the context of the plays involved. We all understand that the same play can have very different effects on a team’s chance of winning depending on the context. But to more consistently evaluate players regardless of the situation around them, we treat all plays as having a neutral context in this respect. To that end, the points-to-wins conversion is instead a multiplier based on the concept of Pythagorean win percentage (or more specifically, Pythagenpat) which essentially uses points scored and allowed to estimate win percentage.
Advanced mathematical interlude:
We can use calculus to estimate, in essence, the slope of the line of wins vs. points, i.e., the extra points needed to add a win. Sabermetric writer Patriot—writing about baseball in a way that applies equally to football—shows how to start from the formula 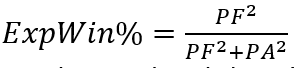 and use partial derivatives to convert it into a formula for points-per-win at a league level that depends only on the scoring environment (in points per game, PPG):
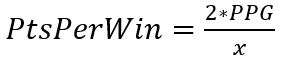 , where x is the
  value that makes the Pythagorean win expectancy most accurate when it’s used as the exponent instead of squaring each term. For 2016 to 2019, with a PPG just over 45, z = 0.73.
The actual number will vary over time, but the translation in recent seasons has hovered around 32 or 33 points per win. Put into different terms, we would expect that a team with a full-season Points Above Replacement of 160 would be around two wins better on average than a team with a total of 96.
The last piece of the puzzle is that because there’s a defined number of wins available each year (although that number changes starting in 2021), there needs to be a constant number of Wins Above Replacement each year.
For a 16-game season, SIS has chosen the number 192, which corresponds to the idea that a 2-14 team is replacement level. This is based on the notion that while teams do occasionally win fewer than two games, the “true talent” of those teams isn’t quite that poor, and a “true” replacement level team would align with that baseline. The total WAR is calculated in the following manner:

If after all the previous calculations the total WAR for the league in a season isn’t 192, the player values are adjusted slightly so that the total ends up at that number. This ensures each season is measured consistently.
Note: From 2021 forward, with a 17-game season, we are still using a 2-win team as the baseline, and therefore there are an additional 16 WAR available, for a total of 208.
What does it look like?
Here’s a glimpse of the 2020 Passing WAR leaderboard found via the DataHub Pro (via the Value tab), with some other metrics that might help give context to how we get to WAR. You can see that Points Earned, Points Above Average, and PAR tell similar stories about the relative value of these MVP candidates, and in particular Tom Brady’s season stands out as one that deserves much more credit than the EPA of his throws would suggest.
| Player | Team | Att | EPA | Points Above Avg | Points Earned | PAR | WAR |
|---|---|---|---|---|---|---|---|
| Patrick Mahomes | Chiefs | 588 | 138.87 | 90.51 | 162.05 | 152.6 | 4.6 |
| Deshaun Watson | Texans | 544 | 115.39 | 78.32 | 157.58 | 145.9 | 4.4 |
| Tom Brady | Buccaneers | 610 | 82.05 | 80.12 | 158.70 | 138.6 | 4.2 |
| Josh Allen | Bills | 572 | 132.46 | 71.20 | 143.19 | 137.4 | 4.1 |
| Aaron Rodgers | Packers | 526 | 143.56 | 85.12 | 154.21 | 137.0 | 4.1 |
Each year roughly half the quarterbacks in the league produce more WAR than any player at any other position, so you just get out of here with your RB-as-MVP conversations. In a 2,000 yard season where he was the centerpiece of his team’s offense, Derrick Henry produced about as much value as an about-to-retire Drew Brees and an about-to-be-shipped-out Teddy Bridgewater.
We know that quarterbacks are much more valuable than other players, but WAR shows just how large that gap really is.