Sports Info Solutions
Category: MLB
-
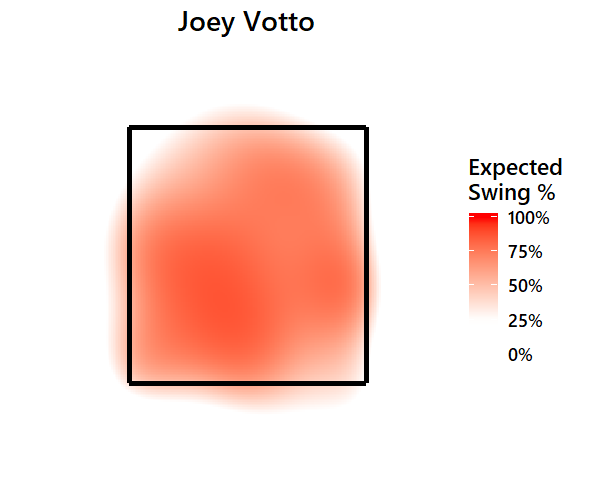
Visualizing Plate Discipline
By
We can put a number on plate discipline. But what does it look like? Where are hitters taking their swings, and how far do they extend their zones?
-
What is Strike Zone Runs Saved?
By
This is our method of telling you who is good at pitch framing and who isn’t.
-
March’s Most Interesting Team Was… the Marlins?
By
Why? Because of their significantly unusual shift usage vs the Rockies this past weekend.
-
What is Team Shift Runs Saved?
By
How do our Team Shift numbers work? What is good and what is bad when it comes to shifting?
-
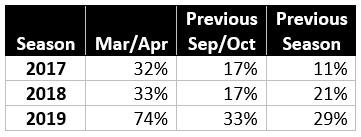
Michael Conforto the Met For Whom Beating the Shift Matters Most
By
Conforto’s numbers against shifts drag down his seasonal totals.
-
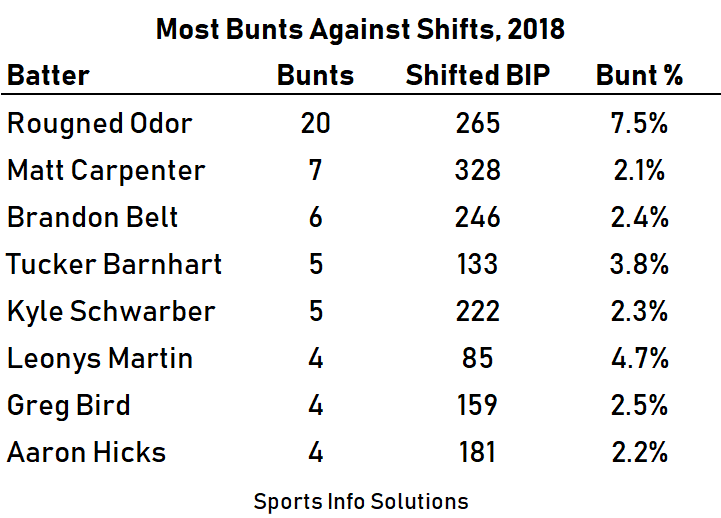
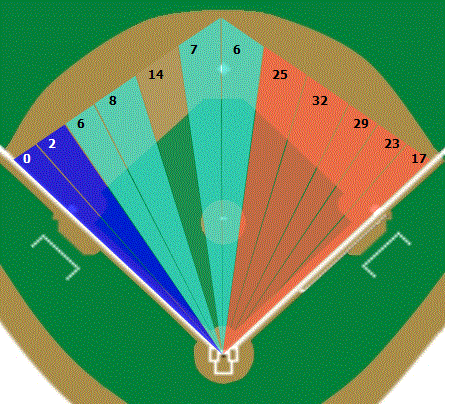
What we can learn from Rougned Odor’s bunts against the shift
By
Rougned Odor bunted against shifts far more than any other player. We watched them. Here’s what we learned.
-
3 Things That Won’t Happen Again For The Astros
By
The 2019 Astros are a little different from the 2018 squad, and a few things that helped the latter might not aid the former.
-
Which catchers get strikes at the top of the zone?
By
Robinson Chirinos has struggled to frame the high strike. Which catchers are best at getting strikes at the top of the zone?
-
Luis Avilan brings unique pitching approach
By
It is rare for a left-handed pitcher to throw a changeup to left-handed hitters. Avilan defies the norm.
-
Stat of the Week: Who were baseball’s top overachievers & underachievers in 2018
By
Mookie Betts, Giancarlo Stanton and A.J. Pollock are among those on our lists.