Category: MLB

  • Stat of the Week: Fielding Bible Awards Preview Part II

    This is the second of a two-part series on the top candidates for The Fielding Bible Awards, which will be announced next week. Part I can be found here.

    The Fielding Bible Awards are voted on by a panel of 12 experts, who can vote based on visual observations and subjective judgement, as well as statistical analysis.

    Part II of our preview looks at outfielders, pitchers and multi-position players.

    (Defensive Runs Saved total in parentheses)
    Left Fielders
    Fielding Bible Favorites: Alex Gordon (18), Adam Duvall (17)
    NL Gold Glove Favorite: Adam Duvall
    AL Gold Glove Favorite: Alex Gordon
    Other top contenders: Corey Dickerson (16), Brett Gardner (8)

    Alex Gordon and Brett Gardner have each won this award three times, and it looks like Gordon has the edge this season. Gordon looked a lot like his old self this season, particularly in June when he was named Co-Defensive Player of the Month. The combination of being able to cover a lot of ground and deter baserunner advancement with his throws was what differentiated him this season.

    Duvall was again a standout, primarily with the Reds, as his playing time was minimal after being traded to the Braves. He’ll battle for the NL Gold Glove with one of the league’s most improved defenders, Corey Dickerson of the Pirates, who went from costing his team a run with his defense in 2017 to saving 16 runs in 2018.

    Center Fielders
    Fielding Bible Favorites: Lorenzo Cain (20), Ender Inciarte (17)
    NL Gold Glove Favorite: Lorenzo Cain
    AL Gold Glove Favorite: Mike Trout (8)
    Other top contenders: Kevin Kiermaier (14), Jake Marisnick (12), Delino DeShields (9)

    No center fielder has won back-to-back Fielding Bible Awards in its 13-year history. The 2018 winner will prolong that trend, as 2017 winner Byron Buxton played only 28 games with the Twins in 2018. Buxton’s loss is Lorenzo Cain’s gain, as he’s the favorite thanks to an 11-run improvement in limiting baserunner advancement from 2017 to 2018 (from costing his team six runs to saving them five). Ender Inciarte of the Braves, who saved the most runs with his positioning and range in center field, will be a formidable foe.

    Note that there is a differentiation in terms of playing time between Fielding Bible Awards rules and Gold Glove Awards rules . As a result, Kevin Kiermaier of the Rays is ineligible for a Gold Glove. Among those eligible, Mike Trout and his 14-run improvement in Defensive Runs Saved from 2017 to 2018 should have a good chance to win.

    Right Fielders
    Fielding Bible Favorites: Mookie Betts (20), Aaron Judge (14)
    NL Gold Glove Favorite: Yasiel Puig (6)
    AL Gold Glove Favorite: Mookie Betts
    Other top contenders: Mitch Haniger (9), Carlos Gomez (8)

    If the Red Sox take Mookie Betts out of right field during the World Series, they’ll be moving the Defensive Runs Saved leader at the position, one who has a chance to win his third straight Fielding Bible Award in right field. Betts’ combination of everything, including two home run robberies (one shy of the MLB lead), put him atop the pack. Aaron Judge might have had a better chance to dethrone Betts had injuries not limited him to 90 games at the position.

    The NL Gold Glove race will be interesting here. Yasiel Puig of the Dodgers has the best numbers of anyone eligible, though Jason Heyward of the Cubs (3 DRS) certainly merits consideration.

    Pitchers
    Fielding Bible Favorites: Zack Greinke (7), Julio Teheran (7), Masahiro Tanaka (7)
    NL Gold Glove Favorite: Zack Greinke
    AL Gold Glove Favorite: Luis Severino (4)
    Other top contenders: Patrick Corbin (6), Clayton Richard (5)

    Pitcher is always a challenging position to vote on due to limited sample size. This may be the year that four-time Fielding Bible Award winer Dallas Keuchel gets dethroned, as he finished with only 3 DRS. Zack Greinke of the Diamondbacks probably has a slight edge over Julio Teheran and Masahiro Tanaka here because of both his reputation (four Gold Glove Awards) and standout performance (for example, he allowed only two stolen bases in seven attempts). Diamondbacks pitchers were a model of fielding excellence, as Greinke’s teammate Patrick Corbin is also a legitimate contender.

    Note again that the AL Gold Glove choice of Yankees pitcher Luis Severino is due to innings requirements that denied Tanaka consideration.

    Multi-Position
    Fielding Bible Favorites: Javier Baez (10), Harrison Bader (19)
    Other top contenders: JaCoby Jones (21), Joey Wendle (5)

    Any time BIS writes about middle-infield defense on either Twitter or atThe Athletic, readers write to sing the praises of Cubs utility infielder Javier Baez, who may not have the most impressive DRS numbers, but who looks the part of the top defender. Baez led non-first basemen in Good Fielding Plays, whether they be showing off his range, tagging, or throwing skills.

    Baez does have good competition this year, particularly from outfielders Harrison Bader of the Cardinals and JaCoby Jones of the Tigers. Jones led all outfielders in DRS this season, splitting his time between center and left. Bader was another who looked the part of the great defender with solid play in center and right. He finished two runs off the outfield lead.

  • World Series Defensive Preview

    The Red Sox are a good offensive team. They scored 876 runs this season, 25 more than any other team. It’s not surprising—or at least not shocking, given their playoff opponents—that they managed to get to the World Series, as they had an offense that featured a potential MVP in addition to a near–Triple Crown winner.

    However, their defense leaves much to be desired. Of all the teams to make the World Series since 2003—when Sports Info Solutions started reporting Defensive Runs Saved (DRS)—the 2018 Red Sox team has the third-fewest DRS at minus-26 (tied with the 2004 Red Sox, coincidentally enough). The infield has been the primary force behind that total, as Red Sox infielders combined to cost the team 60 runs this season, worst in the majors.

    With the news that Mookie Betts may see time at second base to squeeze J.D. Martinez into the lineup in games at Dodger Stadium, an already-shaky defense could become even more concerning. Betts is the best fielder (at least compared to an average player at his position) on the Red Sox, saving 20 runs this season to lead right fielders.

    We can’t be sure exactly how the Betts situation will play out, but, being fairly confident about who will be manning the other positions, it’s worth taking a look at some of the more interesting defensive storylines between the two teams to find where one might have an edge over the other.

    Catcher

    Both teams were at or near the top of their respective leagues in terms of runs saved by their catchers. Sandy Leon saved 12 runs this season, which was tied for the second-highest total at the position. Christian Vazquez, though, was merely average, and has shared time relatively evenly with Leon.

    The Dodgers have two catchers who excelled on defense: Yasmani Grandal and Austin Barnes. Both saved at least nine runs this season, which ranked them top 10 at the position. Based on how much mixing and matching both teams have employed throughout the season, having two solid defensive catchers figures to pay off for the Dodgers.

    Shortstop

    Manny Machado’s transition back to shortstop was a rocky one, as he cost his teams a combined 13 runs at the position, third-worst in baseball (he saved the Dodgers three runs at third base in about 150 innings). He’s shown some improvement, though. Through July 14—or just about the first half of the season—Machado had cost the Orioles 20 runs at shortstop. Since then, he’s worked his way back up to his final total, saving seven runs over the last two and a half months of the season.

    Given that, you’d think that the Red Sox have the advantage defensively. But their shortstop, Xander Bogaerts, cost the most runs of any shortstop in baseball (19). They struggled in opposite areas (Bogaerts was 36 plays below average on plays in the third base–shortstop hole, while Machado was minus-13 on plays up the middle), but Machado has to be given the slight edge here, especially given his improvements as the season wore on.

    Center Field

    Many will say that Jackie Bradley Jr. is the best defensive center fielder in baseball, or if not the best, then at least in the conversation. DRS has largely agreed with that notion in the past, with Bradley finishing no worse than seventh among center fielders in his qualifying seasons between 2014 and 2017 and saving more runs (39) than all but five other center fielders during that timeframe.

    This year, though, Bradley has cost the Red Sox two runs, in large part due to balls that he’s allowed to fall behind him. Despite making three more plays than the average center fielder on balls hit shallow, he’s been five plays worse on balls hit deep, likely due to his playing nine feet shallower on average compared to last year. Those balls lead to extra-base hits, which in turn hurt Bradley Jr. more than balls in front of him help.

    Meanwhile, Cody Bellinger has displayed his athleticism for the Dodgers, saving six runs in center field in his first real season there. That’s not to say Bellinger is decidedly a better fielder than Bradley Jr., but the Red Sox may not have as clear of an advantage at the position as some may think.

    Right Field

    If Mookie Betts remains stationed in right field, the Red Sox have the clear advantage—not just over the Dodgers, but over anyone. Betts has won two straight Fielding Bible Awards, which recognize the best fielder in baseball at each position, and has saved 83 runs since taking over the full-time role in 2016, 22 more than the next-best outfielder (Kevin Kiermaier).

    Of course, if J.D. Martinez sees action there, it’s an entirely different story. For his career, Martinez has cost his teams 31 runs in right field. Admittedly, that’s largely affected by his 2016 season where he cost the Tigers 22 runs. Even ignoring that season, he’s still been average defensively at best.

    For the Dodgers, Yasiel Puig certainly holds his own in right field, at least tying for the ninth-most runs saved at the position each of the last three years. His recent contributions to the team have come from his bat, but he’s more than capable of making a defensive play when he’s called upon.

  • Stat of the Week: 2018 Fielding Bible Awards Preview

    For the next two weeks, this space will feature a multi-part series on the top candidates for The Fielding Bible Awards, which will be announced the week of October 29.

    The Fielding Bible Awards are voted on by a panel of 12 experts, who can vote based on visual observation and subjective judgement, as well statistical analysis.

    This week, Part I of our preview looks at catchers and infielders.

    (DRS totals in parentheses)

    Catcher
    Fielding Bible Favorites: Jeff Mathis (17), Mike Zunino (12)
    NL Gold Glove Favorite: Austin Hedges (12)
    AL Gold Glove Favorite: Salvador Perez (1)
    Other top contenders: Sandy Leon (12), Tony Wolters (12)

    What’s fascinating about the catcher leaderboard for Defensive Runs Saved this season is that it is mostly (though not entirely) composed of part-time players who excel at pitch-framing. At the top of that list is Diamondbacks catcher Jeff Mathis, who led the position by saving 17 runs in just over 500 innings, due not only to his pitch-framing, but also to his pitch-blocking. Mathis was part of a three-catcher unit, all of whom excelled on the defensive side.

    Others who fit the description of part-timers who can frame include Sandy Leon of the Red Sox and Tony Wolters of the Rockies. The AL Gold Glove Award could be a tight race between Mike Zunino of the Mariners, who had a strong year in both framing and thwarting basestealers, and Salvador Perez, whose penchant for basestealing deterrence has helped him win four Gold Gloves in the past.

    Last year’s Fielding Bible Award winner, Martin Maldonado, finished with 3 DRS, 14 back of the MLB lead.

    First Baseman
    Fielding Bible Favorites: Matt Olson (14), Brandon Belt (13)
    NL Gold Glove Favorite: Eric Hosmer (8)
    AL Gold Glove Favorite: Matt Olson
    Other top contenders: Freddie Freeman (12), Joey Votto (9)

    The Bay Area is the home of the two first basemen who led the majors in Defensive Runs Saved. Matt Olson of the Athletics finished with 14. Brandon Belt dealt with injuries for the Giants but still managed to save 13 runs, one fewer than Olson in 530 fewer innings. Belt may have the most range of any first baseman, but Olson is not far behind, and is among the best at scooping throws.

    Within reach of them are Freddie Freeman of the Braves and Joey Votto of the Reds. Olson, Belt and those two are the four first basemen who saved at least 10 runs with their range and positioning. Eric Hosmer also had some of the best numbers of his career at first base. He will be bidding for his fifth Gold Glove.

    Second Baseman 
    Fielding Bible Favorites: Kolten Wong (19), DJ LeMahieu (18)
    NL Gold Glove Favorite: Javier Baez (5)
    AL Gold Glove Favorite: Ian Kinsler (10)
    Other top contenders: Whit Merrifield (8), Ozzie Albies (8)

    If nothing else Cardinals second baseman Kolten Wong should win most improved defensive player. He jumped from costing his team a run with his defense in 2017 to saving it a major league-best at the position 19 in 2018. Wong isn’t as flashy as some other candidates, but he was solid and reliable in covering ground. Same for last year’s winner, DJ LeMahieu of the Rockies, who played virtually mistake-free all season in finishing with 18 DRS, one behind Wong.

    Javier Baez of the Cubs doesn’t have a comparable Runs Saved total, but is held in high regard by many for his ability to do the amazing. He led non-first basemen in Good Fielding Plays. Ian Kinsler, who split the season between the Angels and Red Sox, also had a solid season, though he’s a notch below Wong and LeMahieu in overall performance. He’ll be a top contender for an AL Gold Glove, which would be the second of his career.

    Shortstop Fielding Bible Favorites: Andrelton Simmons (21), Nick Ahmed (21)
    NL Gold Glove Favorite: Nick Ahmed
    AL Gold Glove Favorite: Andrelton Simmons
    Other top contenders: Francisco Lindor (14), Paul DeJong (14)

    Angels shortstop Andrelton Simmons entered this season having won five straight Fielding Bible Awards, and given that he tied for the MLB lead with 21 Defensive Runs Saved, it’s likely he’s headed to a sixth. Simmons was his usual excellent self, covering ground to both sides with aplomb and tying for the MLB lead in Double Play Runs Saved.

    Diamondbacks shortstop Nick Ahmed, the player with whom Simmons tied, may give him a run for his money. Ahmed may have the best arm for a shortstop in the majors, which allows him to get outs from deep in the shortstop-third base hole that others cannot get. He was considerably better than his NL counterparts and should be a favorite for the Gold Glove, too.

    Francisco Lindor of the Indians and Paul DeJong of the Cardinals had good seasons. They’re just not in the same class as the two players at the top.

    Third Baseman
    Fielding Bible Favorites: Matt Chapman (29), Nolan Arenado (5)
    NL Gold Glove Favorite Nolan Arenado 
    AL Gold Glove Favorite: Matt Chapman 
    Other top contenders: Adrian Beltre (10), Travis Shaw (9)

    Athletics third baseman Matt Chapman led the majors with 29 Defensive Runs Saved. No other third baseman finished with more than 10. So it seems like he’s in position to dethrone three-time reigning Fielding Bible Award winner Nolan Arenado. Like Ahmed at shortstop, Chapman’s arm allows him to make plays that other third basemen can’t make — in his case, on balls hit down the third base line.

    Arenado had a down year in Runs Saved, tallying only five. But he was still a regular highlight-reel playmaker. His 45 Good Fielding Plays led the position and make him a favorite to win an NL Gold Glove. Let’s also give a salute to Adrian Beltre, who saved 10 runs in an injury-shortened season. He’s the leader in DRS since it was first compiled in 2003.

  • Which pitchers topped the command rating leaderboard for 2018?

    By HARRIS YUDIN

    The term “command” is thrown around quite a bit in baseball circles, but for the average fan, it may be hard to quantify. Command differs from control — which relates more to pounding the zone with strikes and avoiding free passes — in that command is all about a pitcher delivering his pitches where the catcher calls for them and locating them so the hitter cannot square up the ball, either by painting the edges or getting hitters to chase out of the zone.

    In this piece, I will delve into which pitchers displayed the best command in 2018.

    In calculating command rating, BIS charts every pitch relative to how close it came to hitting the catcher’s glove, then divides them into four buckets — closest to the mitt, close to the mitt, far from the mitt, and farthest from the mitt. Pitchers who keep the ball down tend to fare well in this stat, since most catcher targets are lower in the strike zone.

    The list begins with two expected candidates — Dallas Keuchel of the Astros and Kyle Hendricks. The two sinkerballers, neither of whom have thrown a pitch faster than 93 miles per hour in their respective careers, have found success over the last few years as command artists.

    Hendricks makes his living on the outside corner, nicking the outer edge 1,022 times — only Zack Greinke painted away more often this year. Meanwhile, Keuchel’s bread and butter is the sinker down-and-in.

    He finished 2018 in the top five in pitches within two inches of the lower (385) and inner (618) edges. Keuchel tallied the most total pitches on the edge, but Hendricks paced all starters in the highest percentage of pitches within two inches of any edge of the plate at 57 percent (we’ll call that stat “edge percentage,” which is slightly different from command rating).

    Here are the top 10 pitchers in our command rating from 2018.

    Highest Command Rating
    Percentage of Pitches Rated “Closest” or “Close” to Hitting Catcher’s Target
    Dallas Keuchel Astros 65.0%
    Kyle Hendricks Cubs 64.4%
    Patrick Corbin Diamondbacks 64.2%
    Zack Greinke Diamondbacks 63.6%
    Kyle Gibson Twins 63.5%
    Eduardo Rodriguez Red Sox 62.8%
    Trevor Williams Pirates 60.8%
    Masahiro Tanaka Yankees 60.5%
    Trevor Richards Marlins 60.3%
    Jordan Zimmermann Tigers 60.0%

    Right behind Keuchel and Hendricks is Patrick Corbin. The 29-year-old lefty enjoyed a career year in 2018, cutting back on his fastball usage and relying more on his sharp, back-foot slider — which graded out as the best slider in baseball this season by Fangraphs’ pitch value stats. Corbin clipped the lower edge of the zone more than any other pitcher. He also mustered the second-highest swinging strike rate in the Majors, as hitters repeatedly went after those pitches, but couldn’t hit them.

    Another name that stands out towards the top is Mets starter Noah Syndergaard– a 6’6”, 240-pound power pitcher who has thrown roughly 75 percent of his pitches at least 90 miles per hour this year. He was 13th-best at hitting his spots, surrounded on the list by soft-tossers Jason Vargas, Sam Gaviglio and Mike Leake.

    Syndergaard dotted the edges better than most, managing baseball’s 11th-best edge percentage without relying too heavily on one part of the zone (some have said he should work the top part of the zone more to maximize success).

    Among Cy Young hopefuls, Justin Verlander, Jacob deGrom and Max Scherzer all dominated the upper edge of the zone, not surprising given how often they get hitters to chase high pitches for strikeouts. Corey Kluber, Blake Snell and Aaron Nola mostly utilized the outside edge to rack up strikes all season long. That’s also not surprising, given the reliance that each pitcher has in locating his curveball in the best possible fashion.

  • Why does Xander Bogaerts have such a low Defensive Runs Saved total?

    By MARK SIMON
    With one out and nobody on in the second inning of Game 2 of the ALCS, Astros shortstop Carlos Correa hit a ground ball in the shortstop-third base hole. Xander Bogaerts got to the ball, but took his time in making a throw to first base. Correa beat it out for what was scored an infield hit.

    Two batters later, Josh Reddick popped out for what would have been the third out of the inning had Bogaerts made the play. Instead, George Springer doubled, plating two runs in what could have been a huge moment in the game.

    Baseball Info Solutions received a few inquiries on Twitter as to why Bogaerts has the worst Defensive Runs Saved total of any shortstop in the majors (-19).

    Simply put: It’s because he doesn’t make plays like that one. And that’s whether he gets to the ball or he doesn’t.

    Bogaerts rates worse getting outs on balls hit in the shortstop-third base hole than any shortstop in the 16 years that BIS has collected data. He was 36 plays below average, breaking the mark of 34 below set by Jimmy Rollins in 2013.

    In fairness to Bogaerts, some of this is due to where he’s positioned (he often cheats up the middle), it doesn’t factor in how he fares in shifts (which would likely help him a little), and he’s pretty good at fielding balls hit up the middle and the area in which a shortstop typically plays.

    Let’s explain via example: If we divided the area between second base and third base into thirds, it would be important for our purposes to know how Bogaerts gets outs in that middle-third area, which would cover a lot of the shortstop-third base hole. Here’s the answer in context.

    The average team gets an out on a ground ball hit into that middle-third area by a right-handed batter about 77 percent of the time (the Astros are right at the average).

    The Red Sox got an out about 68 percent of the time on the nearly 400 balls hit to that spot. The difference of about nine percentage points accounts for about 35 fewer balls turned into outs than average over the course of the season.

    To the Red Sox and Bogaerts’ credit, they’ve turned 20 of 22 ground balls and bunts hit into that area into outs this postseason.

    But as we saw in Game 2, one missed play can mean a couple of runs that sent Red Sox Nation into a bit of a panic.

    Fewest Defensive Runs Saved – Shortstops in 2018
    Xander Bogaerts Red Sox -19
    Amed Rosario Mets -16
    Manny Machado 2 Teams -13
    Alcides Escobar Royals -12


  • Who made the biggest improvements vs. pitch types in 2018?

    Who made the biggest improvements vs. pitch types in 2018?

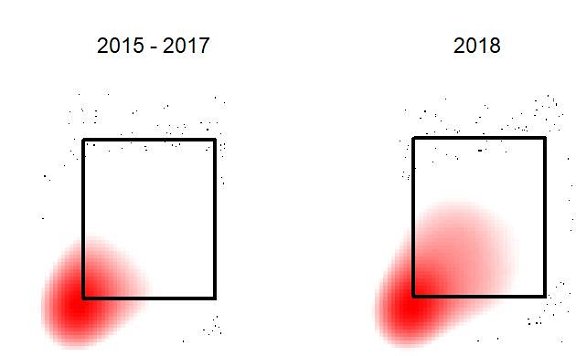
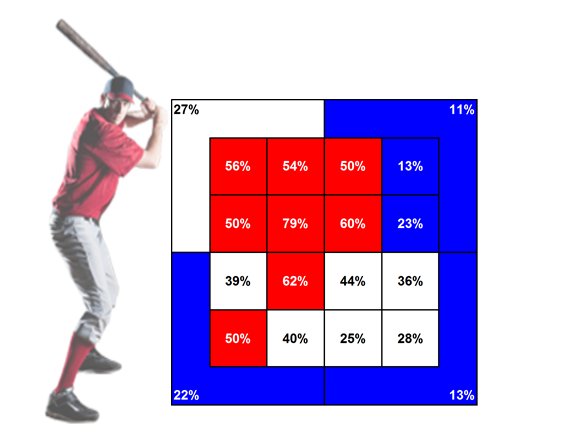
    By MARK SIMON

    Which hitter made the biggest improvement against a pitch type from 2017 to 2018?

    The answer should be no surprise – it’s Christian Yelich, though it wasn’t one pitch type, it was two.

    In 2017, Yelich hit .149 and slugged .194 against curveballs. He had 10 hits, three for extra-bases and recorded 62 outs.

    This season, Yelich hit .370 and slugged .685 against curveballs. He doubled his hit total to 20, had eight extra-base hits, including four home runs, and recorded 33 outs.

    Yelich had a 649-point gain in OPS against curveballs (from .450 to 1.099), the highest of any hitter against any pitch type this season.

    Among those Yelich beat out for the top spot … himself. He had a 447-point improvement in OPS against changeups, going from .507 to .954. He had four extra-base hits on the 401 he saw in 2017. He upped that to 10 on 331 changeups in 2018.

    Biggest Improvement in OPS vs. Pitch Type
    2017 to 2018 (Top player listed for each type, min. 50 PA)
    Pitch Type Points Improvement
    Christian Yelich Curveballs 648
    Cory Spangenberg Sliders 518
    Christian Yelich Changeups 447
    Luke Maile Fastballs 446

    So how does Clayton Kershaw get Yelich out in Game 1? He doesn’t have many options.

    Yelich didn’t make the overall list for sliders, but against sliders from left-handed pitchers, he fared well, going 14-for-46 (.304 batting average) with three doubles and three home runs. That was a vast improvement from 2017, when he went 3-for-35 against sliders from lefties.

    In other words, he made roughly the same number of outs from one year to the next, but added 11 hits to the ledger.

    Yelich had four hits against Kershaw, three vs. sliders, this season – the same number of hits he totaled on sliders from all left-handed pitchers in 2017.

    Given that Kershaw’s fastball took a dip in performance this season, that doesn’t give him many options with which to work. It’s rare that we’d say this about anyone going up against Kershaw, but it looks like Yelich will have the edge in this matchup.

    Thanks to BIS intern Spencer Harrison for his assistance.

    2018 Milwaukee Brewers Photo Day

  • Stat of the Week: 2018 Defensive Runs Saved Leaders

    By Mark Simon

    With the 2018 regular season concluded, let’s look at the leaders in Defensive Runs Saved (DRS). Athletics third baseman Matt Chapman finished as the overall leader with 29. Chapman dominated all season, with his work being particularly outstanding on balls hit down the third base line. The next-closest third baseman in Runs Saved was Adrian Beltre with 10.

    It also helped Chapman that he had an excellent defender on the other side of the diamond to handle his throws. The leader there was his teammate, Matt Olson, with 14. With Olson and Chapman at the corners, the Athletics allowed only 20 ground-ball doubles, tied with the Red Sox for fewest in MLB.

    The outfield leader was a surprise — JaCoby Jones of the Tigers. Jones saved 21 runs, 11 in 55 games in left field and 10 in 67 games in center field. His 15 jumping catches (including a pair of HR robberies) tied for second in the majors behind Billy Hamilton’s 18.

    The DRS leaders at the individual outfield positions were (from left to right) Alex Gordon, Lorenzo Cain and Mookie Betts. Cain’s 20 Runs Saved were a career-high, with the key reason being an 11-run improvement from last season in his arm rating (from costing the Royals six runs to saving the Brewers five). Gordon and Betts each led their position for the third time in their careers, with Betts having done it each of the last three seasons.

    Andrelton Simmons was the co-leader at shortstop, joined by Diamondbacks shortstop Nick Ahmed. Simmons was a standout defender in both directions and tied for the MLB lead with four Double Play Runs Saved. Ahmed had his best season at the position, with his super-strong throwing arm helping him record the bulk of his Runs Saved on balls hit in the shortstop-third base hole. Kolten Wong of the Cardinals finished as the top second baseman. He had a 20-run improvement from 2017, finishing with 19 DRS.

    The Diamondbacks led MLB with 157 Runs Saved, so it’s not surprising the team had three positional leaders. Joining Ahmed is catcher Jeff Mathis, whose 17 Runs Saved in only 523 innings were five better than anyone else there. Also, pitcher Zack Greinke finished tied with Julio Teheran and Masahiro Tanaka with each saving his team seven runs. Mathis was Greinke’s personal catcher and helped him with outstanding numbers in both pitch framing (9 DRS, one shy of the MLB lead) and pitch-blocking (he led the majors with a 96.4 percent blocking success rate).

    Greinke, one of the better athletes among pitchers, will be trying for his first Fielding Bible Award. Those winners will be announced just after the conclusion of the World Series.

    2018 Defensive Runs Saved Leaders
    Position Name DRS
     C  Jeff Mathis 17
     1B  Matt Olson 14
     2B  Kolten Wong 20
     SS (tie)  Andrelton Simmons 21
     SS (tie)  Nick Ahmed 21
     3B  Matt Chapman 29
     LF  Alex Gordon 18
     CF  Lorenzo Cain 20
     RF  Mookie Betts 20
     OF (Overall)  JaCoby Jones 21
     P (tie)  Zack Greinke 7
     P (tie)  Julio Teheran 7
     P (tie)  Masahiro Tanaka 7
     Team  Diamondbacks 157

    Let’s also note that September’s top defensive player is Giants third baseman Evan Longoria. The month represented a significant turnaround for Longoria, who struggled on defense early in the season, then was injured and missed 34 games from mid-June to late July.

    In September, Longoria performed like the player who had 11 Defensive Runs Saved last season and who saved an average of 13 runs defensively from 2008 to 2013. He finished with 9 Defensive Runs Saved for the month, pushing his season total from -3 to 6. His six Good Fielding Plays tied for the most of any third baseman. Longoria totaled five plays by either sliding, diving or jumping in September. He totaled eight for the season prior to that month.

    Defensive Players of the Month
    Month Player Team, Pos
    April Matt Chapman Athletics, 3B
    May Lorenzo Cain Brewers, CF
    June (tie) Trea Turner Nationals, SS
    June (tie) Alex Gordon Royals, LF
    July Keon Broxton Brewers, CF
    August Adam Engel White Sox, CF
    September Evan Longoria Giants, 3B
  • Odd season for Jon Gray, capped by slider struggles

    Odd season for Jon Gray, capped by slider struggles

    By ANDREW ZENNER

    Jon Gray’s 2018 season has been something of a roller coaster ride.

    Following a 2017 campaign in which he posted a 3.67 ERA and 3.18 FIP in 20 starts, along with a start in the NL Wild Card game, Gray earned the opening day nod for the Rockies in 2018. Things didn’t quite go as planned out of the gate, however, and Gray earned a demotion to Albuquerque on June 30th, largely due to his underwhelming 5.77 ERA.

    Gray’s subsequent return on July 14th led to some promising early returns: his first four starts yielded a 1.52 ERA, 0.71 WHIP, and a 3.05 FIP. It looked as if he was back and better than ever after a refresh in the minor leagues.

    But in the eight starts since, Gray has again been disappointing, with a 6.05 ERA and 6.63 FIP over that stretch.

    So what’s the deal with Gray?

    It’s complicated.

    Let’s start with the demotion to AAA. If we were simply to evaluate Gray’s performance through June 30th by using his ERA, the move makes a great deal of sense. However, Gray’s peripheral numbers over that stretch were as strong as ever: he posted a 3.13 FIP, 2.65 xFIP, and a 29 percent K rate – all top-15 marks in the majors and all better than even his sparkling 2017.

    Though these strong peripherals may have signaled that some natural ERA regression was ahead, the Rockies clearly felt something needed to change for Gray to turn that success into run prevention. One issue Gray was having was with runners on base.

    Prior to June 30, his 63 percent “strand rate” was tied with Jason Hammel for the worst in baseball among pitchers with at least 75 innings. Put more simply, when runners reached base with Gray on the mound, they were more likely to score than with any other pitcher.

    In 12 starts since his recall, some of those issues have been alleviated. His strand rate has come back to a much healthier 76 percent and he has even induced eight double plays, compared to just two in his first 17 starts.

    But his eight most recent starts have inarguably been worse than any stretch before his demotion. In addition to the inflated ERA and FIP, his K rate has dipped to 17 percent and his HR/Fly Ball rate has ballooned from 16 to 26 percent.

    It’s difficult to say what, exactly, the Rockies asked Gray to focus on in Albuquerque. Perhaps they sought a mental adjustment to allow him to pitch more confidently with runners on base. But one thing we can point to as a cause for his struggles since returning: the performance of his slider.

    Since his return on July 14 Gray has increased his slider usage from 32 percent to 36 percent

    One thing that has stood out about the slider since his return is how Gray has located it. Below, you’ll find two images that show the locations of Gray’s sliders: on the left, for everything before 2018, and on the right, what he’s done this season.

    The difference is noticeable. His sliders have been near the center of the plate far too often this season, which has been to his detriment since his return to the majors. Before 2018, Gray had thrown 1,258 sliders and allowed only five home runs. Since June 30, he has thrown 390 sliders and allowed seven home runs.

    This dramatic change in performance is possibly due to the fact that hitters have been able to lift his slider more easily: Since his return, 38 percent of the sliders that have been put into play have been fly balls, compared to just 25 percent before 2018. The heat maps possibly speak to why that would be the case.

    Whatever the cause for this development is: whether it’s something mechanical, mental, or just a loss of feel for the pitch; Gray’s ability to rebound from this ugly stretch will depend on the adjustments he makes.

    The slider has actually seen a roughly 2-mph velocity dip, along with a slight change in the movement profile since his recall. So maybe it will simply take time for him to figure out how to locate this slightly different pitch where he wants.

    Some may still view the overall run prevention issues as most problematic going forward, but that can often be an inappropriate way to evaluate pitchers that call Coors Field home.

    Regaining the ability to locate the slider near the edges of the plate would be a major step toward returning to the form that had the Rockies believing he would be their ace for years to come.

  • Why does Bryce Harper have -25 Defensive Runs Saved?

    BY MARK SIMON

    After winning the Home Run Derby, Washington Nationals outfielder Bryce Harper got his hitting back on track in the second half of the season. Since the All-Star Break, he’s hitting .304 with a 1.004 OPS in 55 games. With Harper hitting free agency for the first time this winter, this was significant, as he showed again that he could dominate from that side of the field.

    But the defensive side continues to be an issue for Harper, as it has been all season. He’s never recovered from his early-season struggles.

    Harper has cost his team 25 runs with his defense this season. He ranks tied for second-worst among all players in Defensive Runs Saved. He has fared poorly both in right field (-16 DRS) and center field (-9).

    Range rating gone south
    Harper is 16 runs to the negative in his range and positioning rating, meaning quite simply that he’s not recording outs on balls that most right fielders or center fielders turn into outs.

    As a right fielder, he ranked third-worst in runs saved specific to both balls hit into the right center gap and along the right field line. As a center fielder, he rates well below average on balls hit into both the left and right center field gap. Some of that is due to positioning, but there’s definitely something to the idea that Harper doesn’t have the range he used to have from watching video.

    Negative value from his arm
    This will also be the first season in Harper’s career in which the deterrent value of his throwing arm rates poorly. He’s cost his team six runs with his throwing, partly due to his recording only one assist without a cutoff man (last season he had seven).

    Two seasons ago, 35 percent of baserunners advanced an extra base on hits to right field that were handled by Harper. That number increased to 45 percent in 2017 and 54 percent this season (MLB average is 50 percent). In center field, 21-of-31 (68 percent) advanced on Harper, 13 percentage points higher than MLB average.

    Good Plays and Misplays
    Lastly, Harper’s Good Fielding Play and Defensive Misplay numbers are way out of line with his historical norms. Harper has six Good Fielding Plays (GFPs) and 31 Defensive Misplays & Errors (DM&E).

    There is precedent for Harper having such a high misplay total, but the six GFPs pale in comparison to just two seasons ago when he had 24 in a comparable number of innings (he had 12 last season.

    Harper’s ledger includes six of what SIS calls “wasted throws” that allowed a runner to advance a base, four instances of mishandling a ball after a hit, again allowing runners to advance, and three bad routes, in which he took a poor path to the ball, allowing a ball to drop for a hit. An example of a recent miscue would be slipping and falling on the warning track in a game against the Braves last week, allowing a Ronald Acuna Jr. hit to become a triple instead of a double.

    Harper did make a home run robbing catch against Andrew Susac of the Orioles in late May, but such plays have been few this season.

    Harper could end up in a new home next season, as he is expected to be a highly- wooed free agent. Perhaps a fresh start there will do him good on the defensive end.

  • First things first: Christian Yelich aggressiveness pays off

    First things first: Christian Yelich aggressiveness pays off

    By SEAN ZERILLO

    Welcome to the more aggressive Christian Yelich.

    Yelich is in the midst of his best offensive season to date, with 63 extra base hits in 124 games and an OPS+ of 146 for the Brewers.

    Since the MLB All-Star break, Yelich leads or co-leads the National League in batting average (.354), home runs (16), runs scored (36), runs batted in (42), and slugging percentage (.724). This past week, he checked off a bunch of big career accomplishments – first grand slam, first multi-homer game, six hits in one game, and a cycle. The press from these feats has likely turned Yelich into Milwaukee’s leading candidate for National League MVP.

    One key to his success is that he may have quietly doubled down on what has long been one of his secret strengths – jumping on first pitches.

    Increased Aggressiveness, Continued Dominance

    Yelich has swung at the first pitch 29 percent of the time in 2018, after swinging at just 18 percent of the first pitches he saw the previous two seasons. An 11-percentage point increase equates to nearly 70 more first-pitch swings over a 600-plate appearance season. The significant part of the jump came in the upper half of the strike zone, as you can see the red shading in the image below, which shows his swing rate by area.


    Perhaps as a result of swinging even more often, Yelich has been the best first-pitch hitter in baseball this season, with a .508 average and a 1.102 slugging percentage. He has more extra base hits and twice the number of home runs (8) than his previous two seasons combined.

    Throughout his career, Yelich has consistently been an excellent hitter on the first pitch of his at-bats, with a .444 on-base percentage and a .715 slugging percentage, good for a 1.159 OPS. But he’s never been this good.

    Year MLB First Pitch OPS Yelich’s First Pitch OPS Difference
    2014 .867 .962 .095
    2015 .900 1.204 .304
    2016 .935 1.140 .205
    2017 .941 .991 .050
    2018 .925 1.618 .693

    More Opportunities To Drive the Ball

    Yelich’s first-pitch strike rate is 61 percent this season, five percentage points higher than his career average and a nine-point increase over the rate he saw in 2017. He is swinging more often at those pitches, missing only slightly more often, and driving many more in the air with authority. The extra aggressiveness has been worth it.