Sports Info Solutions
Category: MLB
-
David Bote handled third base well in Bryant’s absence
By
By WILL HOEFER If you’re a fan of baseball, chances are you’ve watched the David Bote walk-off grand slam at least 25 times by now. We’re talking about a perfect moment. In the wake of that, there have been excellent pieces written about the sheer magnitude of that play in terms of Win Probability Added…
-
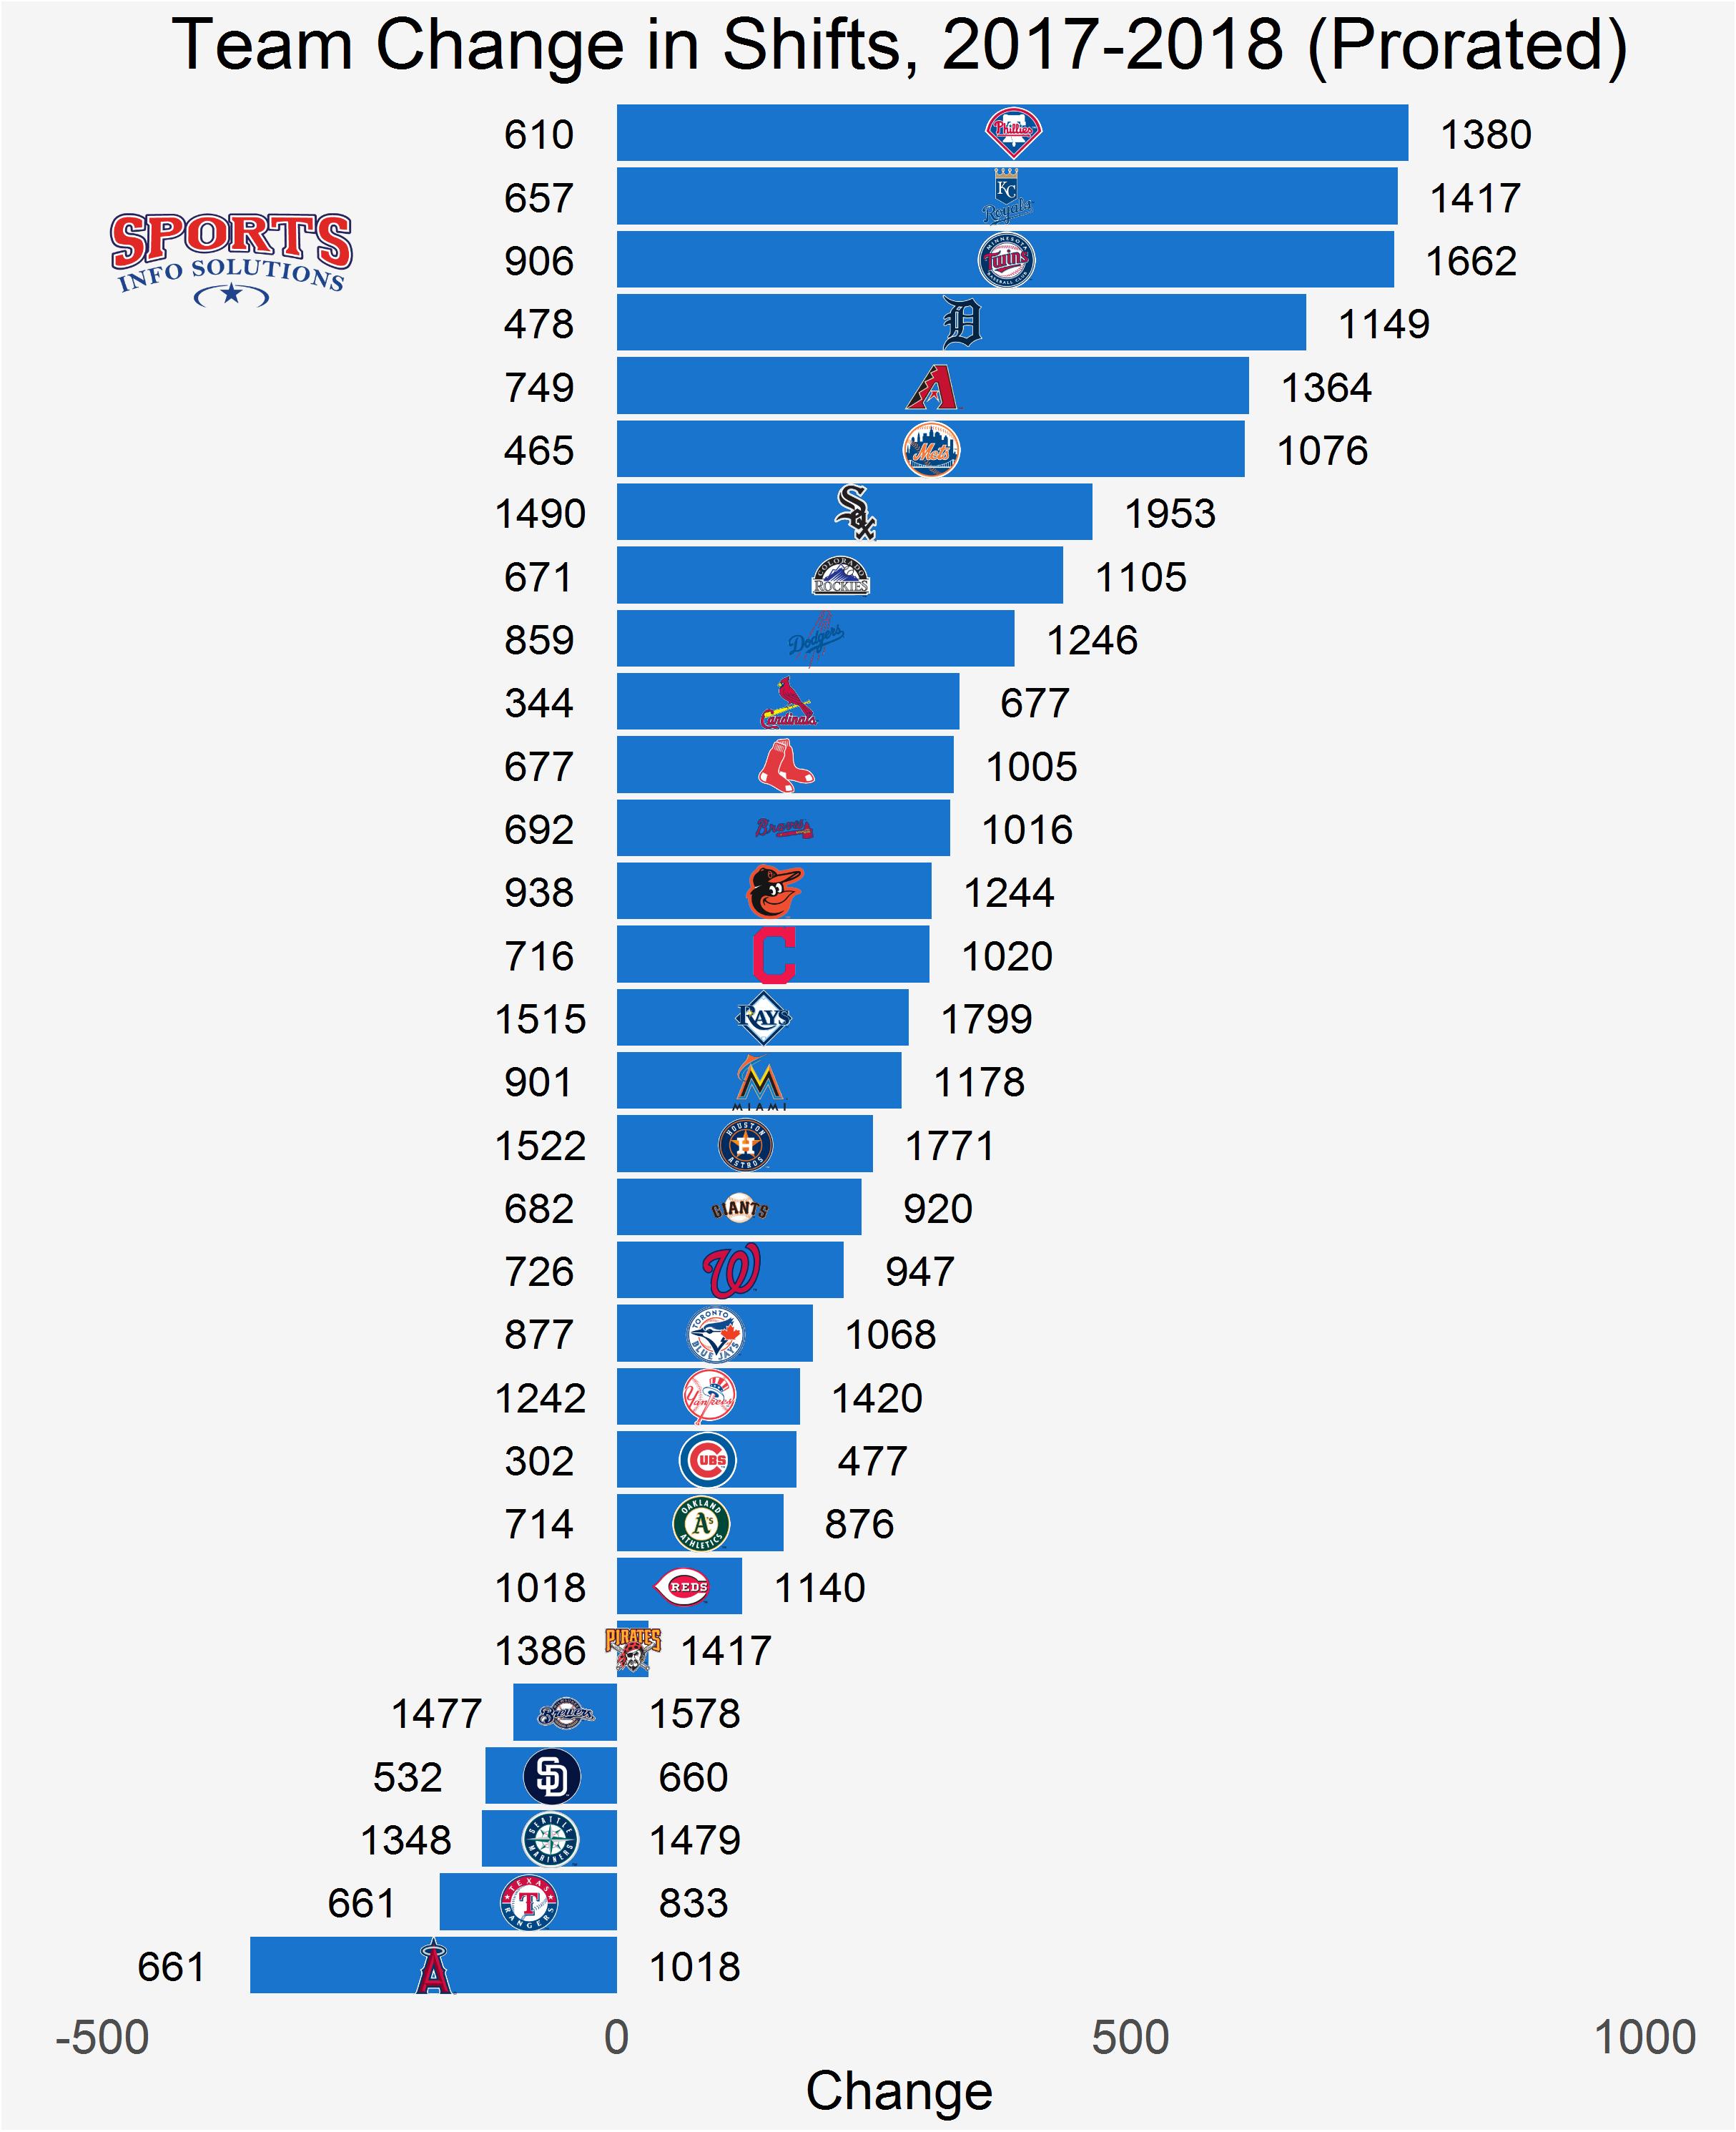
Stat of the Week: Shifting is at an all-time high
By
As of this past Sunday, teams have shifted more in 2018 than in any other season.
-
How are the Diamondbacks 200+ runs better than the Phillies on defense?
By
By MARK SIMON All statistics through Saturday’s games I received a tweet recently that asked if I could demonstrate the difference between the team with the most Defensive Runs Saved (the Diamondbacks with 120) and the team with the fewest (the Phillies with -102). It seemed a reasonable question to wonder – can the difference…
-
Stat of the Week: NL Total Runs/MVP Race is Tight
By
The National League MVP race is shaping up to be incredibly tight with a little more than a month left in the regular season, and it parallels the race for the lead in the Total Runs stat. Total Runs combines Runs Created (offense), Baserunning Runs and Defensive Runs Saved, along with a positional adjustment (but…
-
Matt Olson’s quiet Gold Glove campaign
By
By BRETT BITTIGER Few baseball pundits predicted that on August 16, the Oakland Athletics would be two games back in the AL West and in command of the second AL Wild Card spot. There has been ample coverage of several of the team’s sources of insurgence: Matt Chapman’s highlight reel has led an improved team…
-

Sandy Leon’s defense makes him highly valuable
By
By EZRA RAWDON Red Sox catcher Sandy León has been the topic of much conversation in the baseball universe of late, thanks to this play and the fact that his team is 40-15 when he catches a winning percentage nearly 30 points higher than their absurd overall pace of .698. As someone who got to…
-
Stat of the Week: The Diamondbacks’ Amazing Defense
By
BY MARK SIMON Though we shone a spotlight on the Milwaukee Brewers’ defense last week, we neglected to mention a team that was just a notch behind them. That team has since surpassed the Brewers statistically and currently has no equals on the defensive front—the Arizona Diamondbacks. The Diamondbacks have 108 Defensive Runs Saved this…
-
Who was July’s best defensive player?
By
By MARK SIMON The Brewers are dominating defensively and their outfielders are dominating our Defensive Player of the Month award. We’re picking a Brewers outfielder again, giving Keon Broxton top honors for July. Among those Broxton edged out was his teammate, Lorenzo Cain, who won the award in May. Broxton’s offense did not match his defense though…
-
Who is baseball’s best backup catcher?
By
By EZRA RAWDON Having spent most of my career as a backup catcher at the scholastic and collegiate level, I have developed into a fan of MLB backup catchers. In an attempt to satisfy my curiosity on who might be the most valuable in baseball at the moment, I decided to dig in using some…
-
Which players have been most affected by good and bad defensive plays?
By
We use Sports Info Solutions’ video-tracking to analyze which players have been robbed of the most hits and benefited most from errors.