Category: Baseball

  • 2023 Defender To Watch: Julio Rodriguez

    2023 Defender To Watch: Julio Rodriguez

    Why is Julio Rodriguez a defender to watch in 2023?

    Rodriguez didn’t just win 2022 AL Rookie of the Year and help the Mariners to their first playoff appearance since 2001 through his hitting. Though he finished with only 3 Defensive Runs Saved, that was a huge upgrade from 2021, when Mariners center fielders ranked 28th with -16 Runs Saved.

    Rodriguez wowed fans by extending his range with 20 combined sliding, diving, and jumping catches, the sixth-highest total for an outfielder.

    Most Sliding, Diving, Jumping Catches – Outfielders in 2022

    Player Catches
    Ian Happ 34
    Alex Verdugo 24
    Victor Robles 23
    David Peralta 22
    Daulton Varsho 21
    Julio Rodriguez 20

    His best catch came on the national stage in the postseason against the Astros.

    However, a former Mariners defensive great in center field pointed out that Rodriguez needs to be careful.

    Cameron may be heartened to know that Rodriguez dove for a ball only 6 times in the 2022 regular season (catching 5). Fifteen center fielders had more diving attempts.

    What To Watch: One thing we’ll be watching from Rodriguez is his arm. Baserunners advanced 46 of 80 times they had a chance to do so on a ball Rodriguez fielded or caught. The 57.5% advance rate ranked 5th-highest among the 35 center fielders who played the most innings in 2022. That cost him 2 Defensive Runs Saved.

  • 2023 Defender To Watch: Xander Bogaerts

    2023 Defender To Watch: Xander Bogaerts

    Why is Xander Bogaerts A Defender To Watch in 2023?

    Bogaerts just signed an 11-year, $280 million contract with the Padres, for whom he’ll play shortstop, thus moving Fernando Tatis Jr. to the outfield.

    Bogaerts is coming off the best defensive season of his career. He finished with a positive Defensive Runs Saved for the first time.

    Season DRS at Shortstop
    2014 -5
    2015 -3
    2016 -10
    2017 -11
    2018 -8
    2019 -9
    2020 -4
    2021 -5
    2022 5

    What got better?

    The last two seasons in particular, Bogaerts has been far better in his weakest area – fielding balls hit to his right. From 2017 to 2019, he made 41 fewer plays than expected on balls hit that way. He’s cut that to -3 combined in 2021 and 2022.

    Additionally, of the 35 shortstops who got to the most balls on their forehand in 2022, Bogaerts had the second-highest rate of turning those into outs (94.9%), trailing only Carlos Correa (95.5%).

    Outlook

    As noted in The Bill James Handbook 2023, Bogaerts ranks as the player with the highest injury risk in 2023 by our injury tool’s projections. Bogaerts played in 150 games last season, but left four games early due to injury (hamstring, back) and was taken out of the starting lineup four other times due to lingering back or hamstring issues.

    Also, since 2021 Bogaerts has the second-highest number of sliding, diving, and jumping plays, with 150. Bodily sacrifice is one factor that impacts our injury projections. Given that Bogaerts has recorded an out on 10 of his last 72 dives, keep an eye on whether he changes his approach in that regard in 2023.

  • Why Isiah Kiner-Falefa Rates Well in Defensive Runs Saved

    Why Isiah Kiner-Falefa Rates Well in Defensive Runs Saved

    I’m probably going to get roasted by Yankees fans for writing this, but that’s fine.

    I’m here to explain why, at least by Defensive Runs Saved standards, Isiah Kiner-Falefa is a good defensive shortstop.

    Realize that I’m working at a disadvantage here. The court of Yankee fan public opinion is vocally against me. And the other oft-consulted stat for defensive metrics (OAA/Runs Prevented) rates IKF below-average. That’s fine. They might be right. We might be right too (we were heartened that a newly-developed metric views IKF positively). So let’s present the case for why Defensive Runs Saved rates Kiner-Falefa as it does.

    Establishing where IKF stands

    Kiner-Falefa has totaled 10 Runs Saved at shortstop in each of the last two seasons. He’s done that while playing the fourth-most innings at the position in that time.

    So in the aggregate, he’s tied for the third-most Runs Saved there the last two seasons. Being available as much as he has been is meaningful.

    Most Defensive Runs Saved – Shortstops, Last 2 Seasons

    Player Runs Saved
    Carlos Correa 23
    Taylor Walls 21
    Isiah Kiner-Falefa 20
    Miguel Rojas 20

    But if we look at Runs Saved per 1,000 Innings for the 35 shortstops that have played the most the last two seasons, Kiner-Falefa slips to 10th. So he’s in the top-third of those shortstops results wise.

    What we’re saying here is that availability is part of the Kiner-Falefa story. His skill level becomes more important because it’s maintained over time. He’s a top-third defensive shortstop by skill, a better one knowing that he plays as often as he does.

    What may have left a bad feeling about Kiner-Falefa was how he finished the season. After totaling 7 Runs Saved in August, he dipped to -1 in September and October and was benched in the postseason. He’s also not anywhere near the hitter that any of the prominent free agent shortstops are, which probably – at least subtly – impacts how his defense is viewed.

    There’s been good defense if you’ve watched closely

    To trash Kiner-Falefa for his defense last season is to have a selective memory. You’re omitting some of the good things he did.

    Let’s start with this play, one worth 0.7 Runs Saved.

    And this one, which was worth another 0.6 Runs Saved.

    And these two plays (against Mike Trout and Shohei Ohtani!) worth 0.6 and 0.5 Runs Saved, respectively.


    And this one, which was worth a half-run.

    and these three plays, which ranked at the bottom of his 20 most valuable ones, also worth about a half-run.


    I’d also point out that TV doesn’t always tell the whole story when it comes to shortstop defense.

    This play by Kiner-Falefa was worth 0.7 Runs Saved.

    By the time the YES camera switches to him, he’d moved a considerable distance from his initial position. This play was a lot more impressive if you were watching it in the stands rather than watching on TV.

    In all, Kiner-Falefa made 20 plays worth a half-run or more on his defensive ledger, and was demerited a half-run or more on 30.

    For what it’s worth, there are shortstops with better ratios than 20 vs 30, but it’s worth noting that the two Gold Glovers were not among them – Dansby Swanson was 12 vs 29. Jeremy Peña was 10 vs 31.

    By our plus-minus system (a predecessor of and similar to Outs Above Average), Kiner-Falefa made 11 more plays than the average shortstop in both 2021 and 2022.

    In 2021, he excelled on balls hit to his left. In 2022, he did likewise on balls hit to his right (punch his name in here and you’ll see).

    The Yankees positioned him a little differently than the Rangers did, which might account for the change*.

    * Specifically, they did two things – they played him closer to second base than the Rangers did against right-handed batters who weren’t shifted, and they played him across second base moreso than the Rangers did when left-handed batters were shifted. Head over to Baseball Savant to run through all this.

    Regardless, the bottom line was that he and his teammates got results. The Yankees infield converted 77.2% of batted balls into outs, the second-highest rate in MLB (Cardinals, 77.3%). Our data shows that Kiner-Falefa was an important part of that, even with all his misplays.

    I’ll close with a chart – one that compares how the Yankees fared on ground balls hit past the mound in the area ranging from the second base bag to approximately halfway to third base. Let it be a reminder to Yankees fans how much better Kiner-Falefa fared than their shortstops in 2021.

    Versus Ground Balls Hit From 2B Bag to ~Halfway to 3B

    Grounder Out Rate Plays Made/Opportunities
    2022 Yankees w/ IKF* 69% 151/218
    2022 MLB Average 66%
    2021 Yankees 61% 176/288

    IKF’s Flaws

    I’m not hiding from this point: Kiner-Falefa makes a fair number of mistakes. In addition to tracking errors, SIS tallies Defensive Misplays, an advanced scorekeeping notation to denote plays with a negative consequence that weren’t errors.

    Kiner-Falefa has 83 Defensive Misplays and Errors the last two seasons, second-most in MLB (again with a reminder that he ranked fourth in innings played, so lots of chances to make them). To his credit, he’s actually cut down on those considerably – from 53 in 2021 to 30 in 2022.

    Over the last two seasons, he has the sixth-most Misplays & Errors per 1,000 innings among those 35 shortstops referenced earlier. The top of that list has some players that have had mixed success through our numbers. But you know who ranks seventh? The 2022 AL Gold Glove winner,  Peña.

    And if we only look at 2022, Kiner-Falefa sits right in the middle-of-the-pack, the 17th-highest Misplay and Error Per 1,000 Innings rate among the 35 shortstops who played the most. He was at 25 per 1,000 innings to Peña’s 32.

    So admittedly, he’s not necessarily great. But he’s also not necessarily bad.

    Looking Ahead

    Aaron Boone’s past positive comments about Kiner-Falefa’s defense aren’t just empty rhetoric. There are numbers that do in fact back him up.

    The Yankees will have an intense battle at shortstop in spring training with Kiner-Falefa, second-year infielder Oswald Peraza and top prospect Anthony Volpe all in the mix. But we suspect there are other teams that have seen Kiner-Falefa’s defensive track record that will find a spot for him.

  • Stat of the Week: Celebrating Pitcher and Catcher Defensive Excellence

    Stat of the Week: Celebrating Pitcher and Catcher Defensive Excellence

    Pitchers and catchers report to their MLB teams this week. To celebrate as we get ready for baseball, here are nine pitcher and catcher-related stats celebrating their defensive play.

    1) The catcher leader in Defensive Runs Saved last season was Jose Trevino of the Yankees with 21. Adley Rutschman of the Orioles and Cal Raleigh of the Mariners followed with 18 and 14, respectively. J.T. Realmuto of the Phillies led the NL with 11. Trevino also led all catchers in our pitch framing stat, Strike Zone Runs Saved (12).

    2) The pitcher leader in Defensive Runs Saved in 2022 was Ranger Suárez of the Phillies with 9. Behind him were Suárez’s new teammate, Taijuan Walker, then with the Mets, with 6, and Tyler Anderson, then of the Dodgers, now of the Angels with 5. Wandy Peralta (Yankees), Luis Severino (Yankees), and Yusei Kikuchi (Mariners) tied for the AL lead with 4.

    3) Trevino and Suárez are also the respective leaders at their positions in Defensive Runs Saved over the last three seasons with 29 and 15. Austin Hedges, now of the Pirates, and Max Fried of the Braves are the respective runners-up with 20 and 14 Runs Saved, respectively.

    4) Blue Jays catchers Alejandro Kirk and Danny Jansen ranked 1-2 in our catcher block rate stat that shows how effective catchers are at blocking potential wild pitches*. Kirk blocked 95.9% and Jansen blocked 95.7%. The top non-Blue Jays catcher was Tomás Nido of the Mets, 95.5%.

    * Block rate equals the number of times the catcher blocked a pitch in the dirt or went well beyond normal effort to catch a pitch in a wild pitch situation divided by [the number of blocked pitches plus the sum of wild pitches and passed balls]. Our ranking is based on the top 60 catchers in block opportunities.

    5) Zack Greinke’s 87 career Runs Saved match Mark Buehrle for the most by a pitcher in the 20-year history of the stat (more on that here). The next-most among active pitchers is Clayton Kershaw’s 34 (unless Dallas Keuchel, who has 54, pitches in 2023).

    6) Realmuto was by far the top catcher last season when it came to limiting basestealing. He threw out 42% of runners attempting to steal and his 9 Stolen Base Runs Saved was more than double that of the players with the next-most (Christian Bethancourt, Keibert Ruiz, 4).

    7) The pitcher with the most innings pitched and no stolen bases allowed last season was Cole Irvin with 181. Irvin was with the Athletics in 2022 but was traded to the Orioles in the offseason. Suárez was the only other pitcher with at least 100 innings pitched and no steals allowed (155 1/3).

    8) Yadier Molina retired after the 2022 season. He’s the leader in Defensive Runs Saved by a catcher with 184. The new active leader is Roberto Pérez, now of the Giants, with 79.

    9) Yankees pitchers and catchers finished with 45 Defensive Runs Saved in 2022, matching the 2012 Reds for the most by a pitching-catching combo in the 20-year history of Runs Saved. Those Reds were led by catcher Ryan Hanigan’s 23 Runs Saved.

  • Study: What’s a Small Sample of Defensive Stats Worth These Days?

    Study: What’s a Small Sample of Defensive Stats Worth These Days?

    They say you should catch readers early with a hot take, so here it is…

    The Angels haven’t had much success building a winner around Mike Trout and Shohei Ohtani. 

    No? Eh, back to the drawing board.

    There is one thing that they seem to be doing well of late:

    Giving opportunities to players at positions they had played in the majors a little, but not a lot, who can bring quality defense to the table.

    In each of the last two seasons, an Angels infielder has become a primary contributor at a defensive position that he hadn’t spent much time at previously.

    In 2021, in the first full season after the team’s acquisition of Anthony Rendon, David Fletcher became a full-time second baseman. He had played the better part of a season’s worth of innings at the position across three years in the majors, and saved a pretty solid 13 runs in that time.

    Given a full year of playing time at second, Fletcher was outstanding. He finished as one of the top three candidates for both the AL Gold Glove and the Fielding Bible Award, ranking second at the position in DRS. He didn’t maintain the same elite level of per-inning performance that he had shown in the previous three seasons, but we know not to expect such things.

    David Fletcher Stats as 2B

    Season(s) G Inn DRS
    2018-20 100 729 13
    2021 142 1212 11

    That season, Fletcher’s strong showing was more than counterbalanced by the performance of shortstop Jose Iglesias. The veteran far and away cost his team the most runs of any shortstop, with -22.

    So, in 2022, the team brought in journeyman Andrew Velazquez. 

    He had spent the last three seasons bouncing around four different franchises, with fewer than 200 career Major League plate appearances. A slugger he is not, but he had major league playing time at six positions (including shortstop and center field), so being light on MLB experience specifically at short wasn’t necessarily a deal-breaker.

    When given a full season of opportunity, Velazquez delivered on the defensive upside his limited playing time had suggested. He placed fourth in the majors in DRS among shortstops, and because of his positional value cracked the top 10 in the AL in Baseball-Reference’s Defensive WAR.

    Andrew Velazquez Stats as SS

    Season(s) G Inn DRS
    2018-21 60 360 4
    2022 124 906 11

    Naturally, not all players with small samples of strong (or weak) defensive numbers go on to deliver on their initial impressions when given more opportunity. But the Angels have had some measure of success with it of late. They’re likely going with yet another new face at shortstop this year in Luis Rengifo, whose results are likely to be somewhere in the middle between Iglesias and Velazquez.

    With our database, we can take this out of the realm of specific examples and look at the last decade all at once.

    Both Fletcher and Velazquez are examples of players I’ll call “innings jumpers,” which I’ll define as those who, for a given position:

    • played at least 600 innings more than their previous high 
    • played more innings than they had total in their career 

    We can look at those jumpers to see how well their small-sample numbers translated when they were given a lot more playing time. To do that, I also make sure that the player had at least 300 career innings prior, so there’s enough of a track record to compare to. That gives us 60 such players over the last decade. 

    To give a comparison, I also am including the same stats for a group of players who didn’t have a jump in innings but who also had at least 900 innings at a position in a season (think 300 career minimum + 600 inning jump).

    Here’s how those players looked coming in, and how their performance in the next season correlated with their previous results.

    Innings Jumpers Comparison Group
    Career Inn 545 4,830
    Season Inn 1,184 1,147
    DRS/Inn Correlation 0.43 0.50

    When comparing the players’ career DRS with their results in the next season, the innings jumpers are barely less projectable than the players with a much more pronounced track record.

    We can look at this another way, focusing on the players who had established being above average (+3 DRS per 1,000 innings) or below average (-3 DRS per 1,000 innings), and how they performed in the follow-up season. In this case, we can look at the average DRS per 1,000 innings of the players in that follow-up year compared to what they had shown previously. 

    Players With a Career -3 DRS per 1,000 Innings or Worse

    Innings Jumpers Comparison Group
    Career Inn 557 3,761
    Season Inn 1,202 1,147
    Career DRS / 1000 Inn -12 -6
    Season DRS / 1000 Inn -2 -4

    Players With a Career 3 DRS per 1,000 Innings or Better

    Innings Jumpers Comparison Group
    Career Inn 531 4,981
    Season Inn 1,176 1,149
    Career DRS / 1000 Inn 10 9
    Season DRS / 1000 Inn 3 5

    This exercise illustrates the power of regression to the mean.

    The innings jumpers showed strong (positive and negative) results in small samples, and in general maintained that direction of performance when given more opportunity, but were much closer to average.

    The comparison players didn’t have as extreme performance prior, but they “held onto” their track record more in the following season. 

    These results are encouraging for the value of small-sample defensive metrics, at least directionally.

    The key takeaway: Players who show themselves to be solidly above or below average in limited playing time are as likely to maintain that as those with much longer track records. 

    There are some limitations, however. We shouldn’t expect the scale of a player’s small-sample performance to maintain itself (as seen in the last table). We’re looking at players who did actually play a full season, but many players who are given opportunities don’t play well enough to get there. (I don’t think that’s a huge concern, because we’re also showing an effect for poor defenders). And this is still a pretty small group of players to evaluate, based on the constraints we’re putting on it. 

    All that said, it’s a compelling jumping off point for the defensive metric enthusiasts among us. And it gives us a bit of a framework within which to talk about players like Brendan Donovan and Bryson Stott, who are being given the keys to a position that they dabbled with in their MLB debuts.

  • Reimagining The 2022 Yankees & Giants as Average Defensive Teams

    Reimagining The 2022 Yankees & Giants as Average Defensive Teams

    We know that sometimes we’ve gotten caught up in the idea that Team Defensive Runs Saved are some sort of absolute declaration pinpointing specifically how good or how terrible an MLB team is

    But at a practical level it doesn’t quite work that way.

    Defensive Runs Saved are theoretical. A player and his team don’t receive two Defensive Runs Saved for a diving catch on a ball with runners on second and third and two outs. Our numbers are derived from out probabilities and base/out context-neutral run values.

    Also, the way Defensive Runs Saved was created was to evaluate players, not teams. Thus the combination of our use of rounding (if a player has 0.6 Runs Saved from fielding bunts, it rounds up to 1) and that team out probabilities don’t always match player out probabilities means that our numbers are good at assessing teams from top to bottom, but not necessarily exact when it comes to evaluating actual Runs Saved.

    We bring all that up to get to the fun part. We wanted to look at two MLB teams from 2022 to see how much would change if their defenses were average across the board. Those teams were the No. 1 (Yankees) and No. 30 (Giants) ranked teams in Defensive Runs Saved with 129 and -53, respectively.

    Strat-O-Matic, an industry leader in baseball simulations dating back to 1961 (and a client of ours), was able to help us out. They incorporate our defensive stats as one part of their player evaluations.

    Strat ran 50 computer simulations* of the Yankees and Giants seasons using their pre-generated season ratings and player usage information. We’ll refer to these as the “Real Life” Yankees and Giants.

    They then ran 50 simulations for both teams with every possible defensive component for every player changed to average.

    *In a scientific study, we’d do 10,000 simulations but that was not practical here

    Here’s how the numbers came out

    2022 Yankees (50 Simulations of Each)

    “Real Life Defense”  “Average Defense” 
    W-L 101-61 94-68
    Runs Allowed 583 642
    ERA 3.31 3.67
    Opponents’ BABIP .269 .278

    The Yankees team with an average defense allowed an average of 59 more runs per season and won 7 fewer games per season than their “real life” counterparts.

    They still won at least 90 games in 39 of the 50 simulations (78%) and allowed an average of 4 or more runs per game 22 times (44%), including one aberrational season in which they allowed 753 runs (51 more than any other simulation).

    One thing not mentioned in the chart above was the impact on catcher defense. The team with an average defense allowed 25 more wild pitches and 25 more stolen bases (though with 12 more caught stealing) then its standout counterparts.

    The Yankees team from which we used real-life ratings averaged 101 wins (two more than the actual 2022 Yankees had). They won at least 100 games 30 times (60% of the time), three times as often as their average defense counterparts.

    From all this, we think you can glean that the difference between being average and excellent defensively was the difference between the Yankees being a likely division winner to a near-certain one.

    2022 Giants Averages (50 Simulations of Each)

      “Real Life Defense”  “Average Defense” 
    W-L 77-85 82-80
    Runs Allowed 700 659
    ERA 3.93 3.74
    Opponents’ BABIP .316 .298

     The 2022 Giants were a problematic team defensively, struggling to turn ground balls into outs for most of the season. Fly balls to left field in particular were often an adventure for Joc Pederson and others.

    In looking at the results of 50 simulations of the Giants with their actual defense, they averaged 77 wins. The 2022 Giants won 81, so maybe there’s a message here that the real team overachieved a little bit.

    Nonetheless, within the simulations there’s an average difference of  5 wins and 41 runs allowed between a Giants team with a bad defense and one with an average defense.

    One really big improvement was that the Giants opponents’ BABIP decreased by 18 points with an average defense, which likely would have made things a lot less stressful for their pitchers. The average-defense Giants also made an average of 21 fewer errors and allowed 19 fewer stolen bases (with 2 fewer caught stealings) than their poor-performing counterparts.

    The final playoff spot in 2022 (actual results) went to the 87-win Phillies. The Giants with an average defense won 87 games 10 times (20% of the time). The “real life” team with the problematic defense got to 87 wins 3 times (6% of the time).

    So fair to say, the playoffs were not a likely proposition with an average defensive team. But there was a better path there than what actually existed based on their real-life numbers.

    The best playoff path for the Giants was arguably the best playoff path for most teams: Be one of the better defensive teams in the sport. Nine of the top 15 teams in Defensive Runs Saved made the playoffs last season, including all six division winners.

  • What Has 20 Years of Defensive Runs Saved Data Meant to Baseball?

    What Has 20 Years of Defensive Runs Saved Data Meant to Baseball?

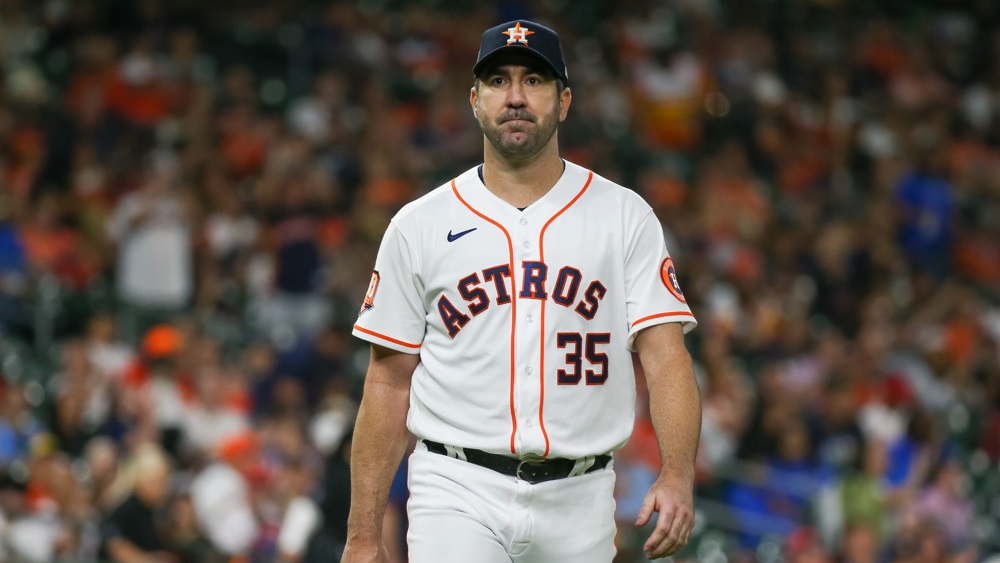
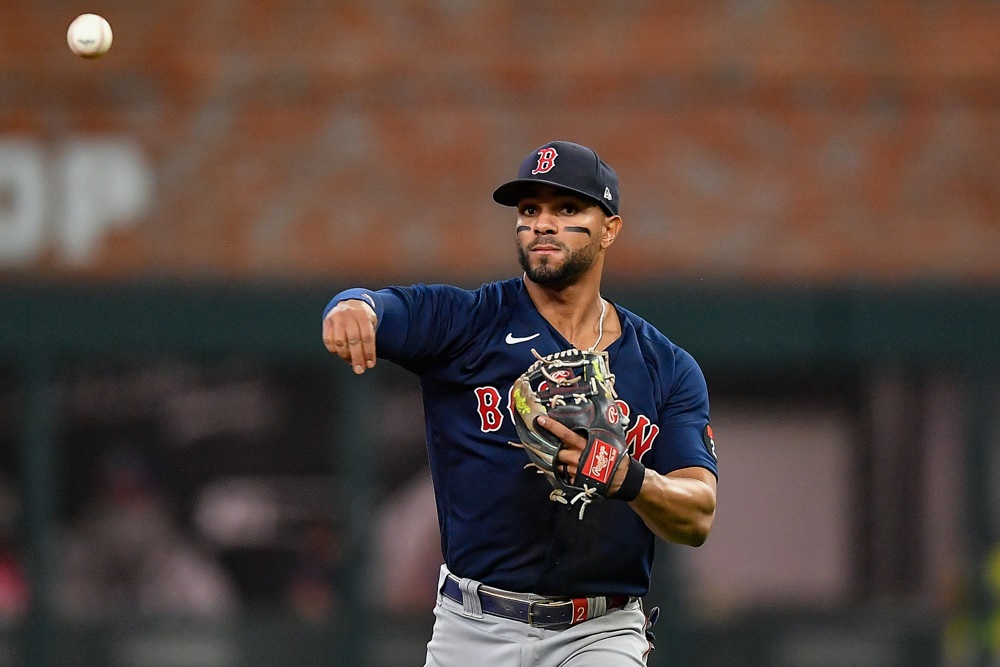
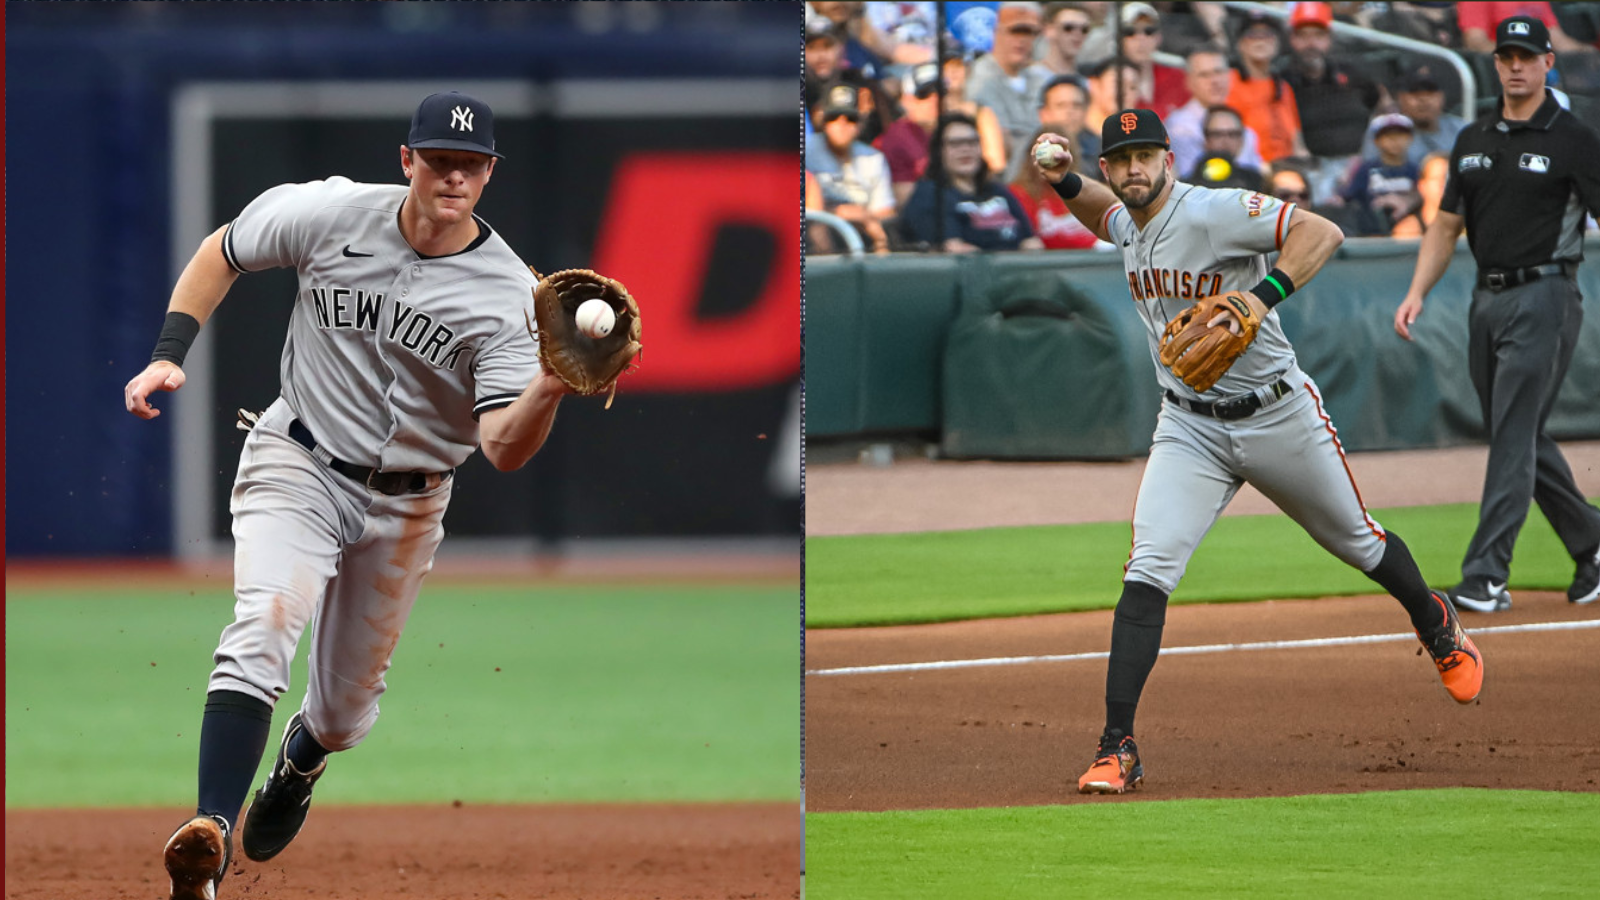
    Sitting back behind the pool in a newly-built house in a suburb about 40 minutes north of Atlanta, former Braves catcher Tyler Flowers has a special appreciation for defense and defensive metrics. He knows that’s what got him paid.

    “If I was born 10 years earlier, my career would have been over in two years,” said Flowers, who now works for the Braves analytics department developing pitcher-catcher game plans “(The value of pitch framing) is 100% of the reason why I’m sitting here right now.”

    Phillies general manager Sam Fuld had a similar sentiment when we talked to him on our company’s baseball podcast a few weeks ago.

    “I’m always going to be a little bit biased because I think that’s how I became a major leaguer,” Fuld said of defensive metrics. “Without my defensive value, I would have been hanging up my cleats a lot earlier than I did.”

    Flowers is our No. 1 catcher overall in our Strike Zone Runs Saved metric, which we began tracking in 2010. Fuld is the No. 1 outfielder in Defensive Runs Saved on a per-inning basis dating back to the stat’s inception in 2003.

    The availability of these metrics, whether they are ours or come from other sources like FanGraphs, Baseball-Reference, Statcorner, Baseball Prospectus, or Baseball Savant, allows us to learn things like this that we wouldn’t have known previously.

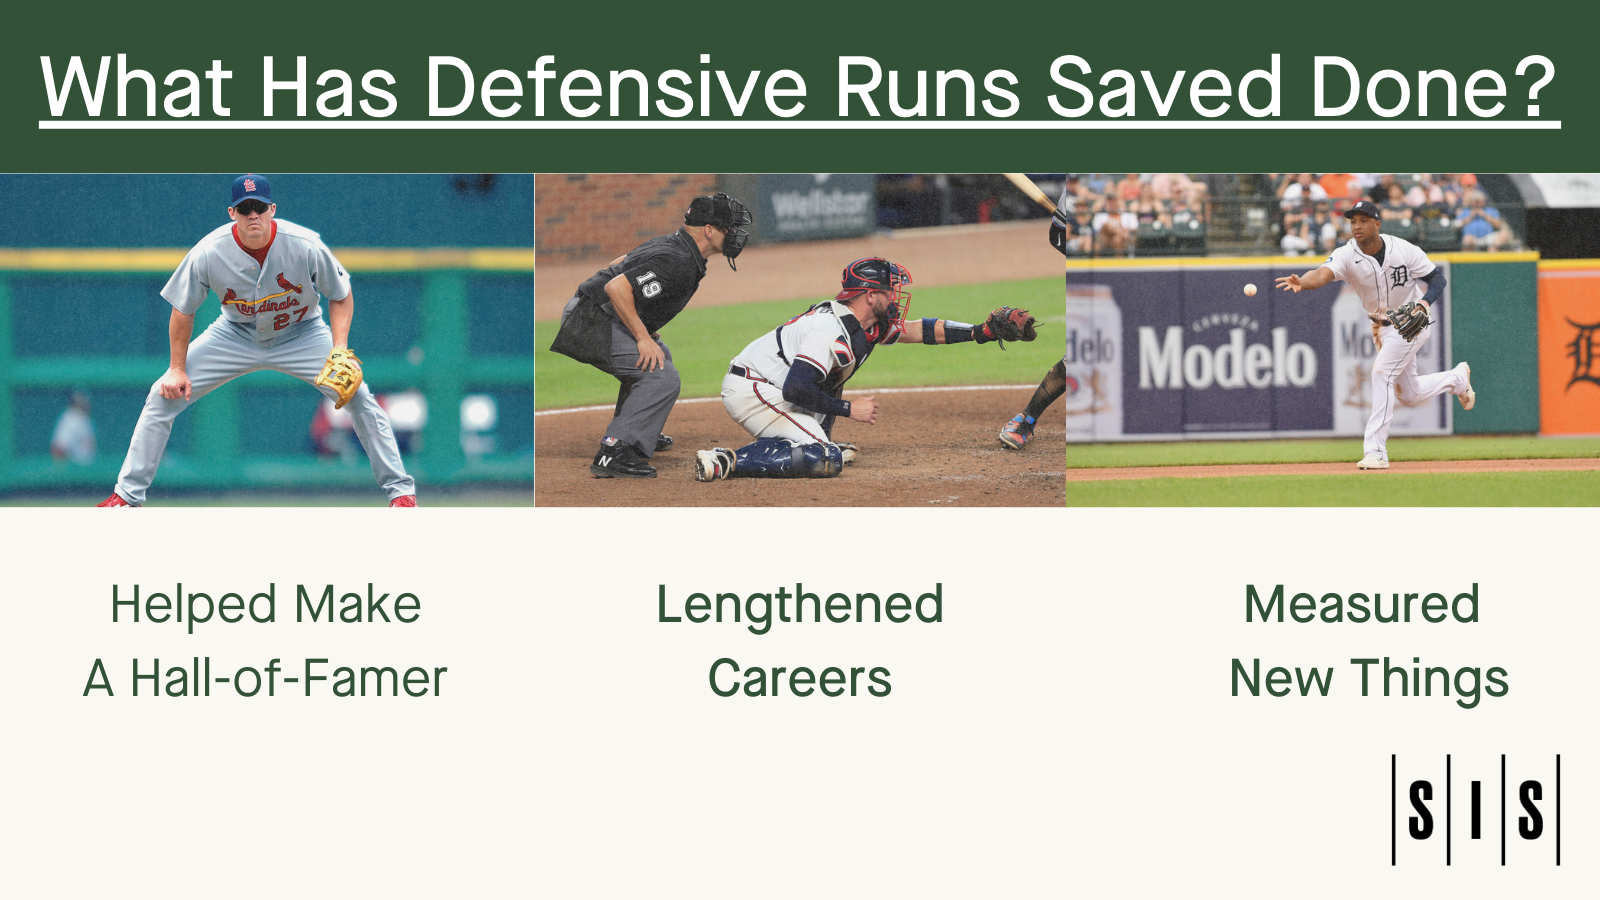
    With the availability of 20 years of Defensive Runs Saved data, I thought it would be cool to look at the impact it had on our knowledge and understanding of players and their skills.

    It helped a player become a Hall of Famer

    This one’s pertinent because of its recency. Scott Rolen’s election to the Baseball Hall of Fame was helped by his defensive metrics.

    To wit, Rolen ranks 17th among third basemen in Baseball-Reference’s Offensive Wins Above Replacement. Most of the players surrounding him on both sides: Sal Bando, Ken Boyer, Graig Nettles, David Wright, and Ron Cey aren’t in the Hall of Fame. Rolen’s offensive stats resemble Cey’s, with whom he’s tied in career home runs with 316.

    People know that Rolen was a great defensive third baseman. But a system like Defensive Runs Saved, in which we can scale Rolen’s defensive numbers* with his offensive numbers, vaults him to 10th in Jay Jaffe’s JAWS Hall of Fame rating. That’s the kind of thing that can and probably did sway a BBWAA Hall voter or two … or enough to get Rolen into the Hall of Fame.

    * 114 Defensive Runs Saved, 3rd-most of anyone at the position without even counting 1996 to 2002, which pre-date the stat.

    Maybe it’ll help some others

    Zack Greinke just re-signed with the Royals and we’re guessing it’s not on his radar that he’s tied with Mark Buehrle for the most Defensive Runs Saved by a pitcher in the last 20 years, or one Bunt Run Saved shy of Adrián Beltré for the most in the 20 years we’ve kept track of that stat. Someone just asked me if I thought Greinke was a Hall of Fame candidate. I made the comp to Rolen, saying he’s borderline, but maybe the defensive excellence is a factor in pushing him over the top.

    The same could be said for Chase Utley, who’s on next year’s Hall of Fame ballot. Utley ranks second in Defensive Runs Saved among second basemen

    Over the last 20 years. Utley ranks 19th among second basemen in the Offensive Component of WAR, but his Defensive WAR helps bump him to 12th overall in JAWS.

     It flipped a script

    I’m not here to relitigate this, but rather just to restate the study that put defensive metrics on the map, so to speak.

    Defensive Runs Saved shows that Derek Jeter made considerably fewer plays than expected at shortstop, far fewer than would be expected from a player who won five Gold Gloves. And Adam Everett, who never won a Gold Glove, made considerably more plays than expected.

    Bill James illustrated this with three different methodologies in an essay introducing how our defensive stats can be applied. Want to read it? You can find it here.

    It helped get big-time players paid

    Jason Heyward had his two best seasons in Defensive Runs Saved in the two seasons leading into his free agency. Heyward garnered an eight-year, $184 million contract from the Cubs in the 2015-16 offseason, after a year with the Cardinals in which he overwhelmingly led right fielders with 24 Runs Saved, while posting a respectable but not overwhelming 117 OPS+.

    Heyward’s 2.3 Defensive WAR, as calculated by Baseball-Reference, vaulted him into an elite group of players at just the right time.

    Heyward was most likely paid for the tantalizing potential he showed early in his career. But the great defense, particularly chasing down fly balls hit to the deepest part of right field, certainly helped.

    It made and lengthened careers

    Fuld and Flowers both acknowledged that they wouldn’t have gone very far without the existence of metrics that showed the value of their defensive skill.

    In Fuld’s case, he’s talking about the 2011 season when he tallied 11 Runs Saved and made great play after great play. As such, he stayed in the majors for four more years, with teams willing to keep him around even though his OPS+ in that span was 72.

    Fuld was among a good number of fly ball chasers who have been financially rewarded and had their careers begun and extended because we can more accurately put a number to their value in the field. That includes Platinum Glove Award winners like Kevin Kiermaier and others who have made long runs of being part-timers and specialists like Jarrod Dyson.

    In Flowers’ case, we weren’t the only ones to come up with stats to measure pitch framing. Stat Corner and Baseball Prospectus were among the other early pioneers in the field. Collectively, we all established value for a certain type of catcher, beyond those who could hit like Buster Posey and Yasmani Grandal, or do everything like Yadier Molina.

    What the Strike Zone Runs Saved component of DRS did was show that the value of the likes of Flowers and many others (Chris Stewart, Jose Molina, Jeff Mathis, and two current Flowers favorites, Max Stassi and Austin Hedges, for example) was significant.

    “It was my biggest asset and my biggest strength,” Flowers said. “I took a lot of time, if not the majority of my time, to find a way to become better and better at it.”

    It showed us other things we thought about but couldn’t quantify for catchers

    Another defensive stat that plays a role in Runs Saved is pitch block rate.

    That stat enhanced the value of someone like Jonathan Lucroy, who was not just a great pitch framer in his prime. He also had a brief run as an elite pitch blocker.

    Blocked pitches, which SIS Video Scouts have been tracking since 2004, have a run value of about 0.3 runs, wild pitches and passed balls cost catchers about a quarter of a run. A catcher’s totals in each of these are summed and compared to expected performance based on pitches caught.

    Over the years, we’ve found that the average pitch block rate is usually around 91%. The elite catchers will be 93% or higher. The subpar catchers are usually in the 86-87% range.

    In 2014, Lucroy blocked 801 pitches in all, blocking 95.7% of potential wild  pitches. The 801 blocks is the most by any catcher in the 19-year history of our tracking (we didn’t track this stat in 2003).

    Lucroy’s doing so at an elite rate resulted in him totaling 10 Good Play/Misplay Runs Saved*, tied for the most by a catcher in any season (Robinson Chirinos matched that with a 96.2% rate, though only 535 blocks in 2019).

    * Good Play/Misplay Runs Saved combines pitch blocking with things like well-executed blocks of home plate

    What we thought about but couldn’t quantify for Infielders …

    Pitch framing and its stats get a lot of the attention because the impact is so vast, but 20 years of evaluating defense have led to quantifying several other previously unmeasured areas.

    Any ball hit that is fielded by a middle infielder in a double play situation is considered an opportunity, one that is either converted or not. A player’s Double Play Runs Saved is based both on their conversion rate, the number of opportunities, and batted ball locations relative to being able to turn them into outs.

    The 2022 leader in this stat was Tigers second baseman Jonathan Schoop, who had 4 Double Play Runs Saved off a conversion rate of 74% (MLB average was 62% for second base, 61% for shortstops).

    The 20-year leaders in Double Play Runs Saved are Ian Kinsler and Andrelton Simmons with 23. The most Double Play Runs Saved on a per-inning belongs to Alex Cora. As a shortstop Cora converted 72% of double play chances. 

    What we thought about but couldn’t quantify for outfielders …

    We’ve also created ways to go beyond assists in quantifying outfielder arm value. They don’t make em quite like right fielder Richard Hidalgo’s anymore. In 2003, the first season of Defensive Runs Saved, Hidalgo had 22 outfield assists for the Astros, including 19 that did not involve the use of a relay man (in our system an outfielder gets full credit for throws that don’t involve a relay and half-credit for those that do).

    In all, Hidalgo netted 17 Outfield Arm Runs Saved that season, setting a standard that has not been surpassed since then. For context, Joey Gallo led the way with 11 in 2021. Aristides Aquino led the majors with 8 Outfield Arm Runs Saved in 2022. The 20-year leader is Jeff Francouer with 57.

    They enhanced our understanding of the game

    When John Dewan and Bill James began to dig a little deeper into player defensive evaluation 20-plus years ago, they wanted to go as far beyond putouts, assists, and errors as they could.

    There was resistance at first, but there was also support in the form of other like-minded people working on similar projects (Sean Smith, Tom Tango, Mitchel Lichtman among them). More people working on it meant more information available.

    Eventually the value in stats like Defensive Runs Saved and other metrics became evident. Now, it’s a part of everyday baseball vocabulary.

    “It’s certainly a big part of how we evaluate players,” Fuld said.

    That a general manager would say that shows just how far defensive stats have come.

  • Stat of the Week: Zack Greinke’s Defense

    Stat of the Week: Zack Greinke’s Defense

    Let’s hear it for pitcher defense!

    This is a topic we don’t get to touch on much but it’s pertinent this week with Zack Greinke re-signing with the Royals.

    Why? Because this is the Defensive Runs Saved leaderboard for pitchers. SIS began tracking the stat in 2003.

    Pitcher Defensive Runs Saved
    Zack Greinke 87
    Mark Buehrle 87
    Jake Westbrook 63
    R.A. Dickey 60
    Dallas Keuchel 54

    Greinke is tied for the lead with Mark Buehrle, though there’s an asterisk there. Though Greinke’s career began in 2004 and is thus entirely encapsulated by Runs Saved, Buehrle’s career began in 2000 and thus is not entirely captured by our data.

    Nonetheless, we can agree that Greinke is very, very good. He’s still a terrific athlete even at age 39 even if he hasn’t quite kept pace with his early-career numbers. His 9 Runs Saved over the last three seasons rank tied for 6th among pitchers. Consistency is a differentiator both for Greinke and Buehrle. Each has nine seasons with at least 5 Runs Saved, most of any pitcher.

    Greinke has excellent reflexes

    He’s quick off the mound

    He can keep runners close or pick them off.

    And his throws to any base are right on target.

    There isn’t much bunting done these days but you probably don’t want to bunt on Greinke. His 14 Bunt Runs Saved rank 2nd among all players, trailing only Adrián Beltré’s 15.

    Here’s one good Greinke bunt play, as called by Vin Scully.

    Greinke generally plays the position mistake-free. He hasn’t been charged with an error since getting in Charlie Blackmon’s way and getting called for interference as Blackmon was rounding first base and trying to go to second base in a game in July 2019.

    Our Video Scouts have credited him with only one Defensive Misplay the last three seasons, picking up and then rushing a throw on a Shohei Ohtani roller that appeared to be heading foul in April 2021.

    By our accounting, the last instance we have of Greinke not cleanly fielding a ball that cost his team a potential out was in August 2019 on a play where bat and ball came at him at the same time, thus preventing a possible double play (they still got one out).

    There are no active pitchers even close to Greinke’s accrued Runs Saved. As you can see in the chart, Dallas Keuchel is 33 runs behind, but given that he had a 9.20 ERA last season, there’s no guarantee he’ll pitch again in the majors. The next-closest active pitchers are Clayton Kershaw (34), Johnny Cueto (33), and Justin Verlander (31).

    Someone asked me the other day if Greinke was a Hall of Famer. I think the answer is similar for him as it is for Scott Rolen. It’s a close call looking at his basic career stats. But there are some other things to consider, like standard-setting defense, that could help in pushing him over the top.

  • CF Defense In The News: The Current King & The Aspirant

    CF Defense In The News: The Current King & The Aspirant

    Elite center field defense was in the news this week. One player who plays it is moving on to another team. Another player expressed his desire to be an elite defender despite never having played the position before as a pro.

    Michael A. Taylor is the elite center fielder. Taylor was just traded by the Royals to the Twins for two minor leaguers.

    Taylor has led center fielders in Defensive Runs Saved in each of the last two seasons. His 38 Runs Saved since 2021 lead the position and there’s a huge gap between him and No. 2 Myles Straw. Taylor won both a Fielding Bible Award and a Gold Glove in 2021 and narrowly missed winning the former again last season.

    Taylor rates particularly well at chasing down fly balls hit to the deepest part of the ballpark and using his throwing arm to deter baserunner advancement.

    This gives the Twins the luxury of two elite defensive center fielders in Taylor and Byron Buxton, who will now likely get a fair amount of playing time as a DH. The Twins should be strong up the middle this season with Carlos Correa returning at shortstop, newcomer Christian Vázquez at catcher and either Buxton or Taylor playing center fielder.

    The elite center field aspirant is Jazz Chisholm Jr. of the Marlins. After showing considerable potential playing second base and shortstop the last three seasons with the Marlins, Chisholm is embracing the challenge of switching positions.

    Simply put: It’s going to be difficult, even for an elite athlete.

    In the 20-season history of Defensive Runs Saved, there are eight examples of players who transitioned from second base or shortstop to center field the next season within the following criteria:

    A)Played no more than 250 career innings in center field prior to moving there.

    B)Played at least 300 innings at either middle infield position one year and then played at least 300 innings in center the next.

    Player Team
    Bill Hall 2007 Brewers
    Dustin Ackley 2013 Mariners
    Alexi Amarista 2013 Padres
    Chris Owings 2016 Diamondbacks
    Ian Desmond 2016 Rockies
    Dee Strange-Gordon 2018 Mariners
    Ketel Marte 2019 Diamondbacks
    Scott Kingery 2019 Phillies

    You may remember some of these. Hall, Marte, Ackley and Strange-Gordon had played a good amount of middle infield and done well, with Strange-Gordon winning a Gold Glove.

    Hall and Marte fared okay initially. They were the only players in the eight-player sample to have a positive Runs Saved in the season in which they made the move. But these are not long-term success stories.

    Hall saved 2 runs in center field in 2007 but moved to third base the next year and played only 49 innings in center field the rest of his career.

    Marte saved 4 runs there in 2019, moved back to second base for 2020, then his return to center field in 2021 went poorly (-15 Runs Saved). In 2022, he returned to second base.

    It didn’t go well for Ackley, Desmond or Gordon, with each playing center at a rate of -10 Runs Saved per 1,000 innings or worse in their first season at the new spot. Same for Alexi Amarista of the 2013 Padres.

    Chris Owings and Scott Kingery were the other two players in our grouping. Owings got a look in center field with the Diamondbacks in 2016 and had -1 Runs Saved in just over 400 innings. When managers have put Owings in the outfield since then, it’s usually been right field.

    Kingery, who had played center field in college, got close to 500 innings in center field in 2019 and tallied 0 Runs Saved. He’s played 69 innings there since.

    Chisholm has fully embraced the move, telling new manager Skip Schumaker he wants to win a Gold Glove. He’s been watching video of Ken Griffey Jr. play center field because he says he wants to learn from the best.

    He’d do well to watch some video of Taylor too.

  • Stat of the Week: 2024 Baseball Hall of Fame Ballot

    Stat of the Week: 2024 Baseball Hall of Fame Ballot

    The neverending debate that is Baseball Hall of Fame worthiness can move ahead to 2024 after the elections of Scott Rolen and Fred McGriff to 2023’s Hall class.

    Next year’s BBWAA ballot includes not just prominent holdovers like Todd Helton, Billy Wagner, and Carlos Beltran, but also three newcomers who surpass the standard set by Bill James’ Hall of Fame Value (HOF-V) stat.

    HOF-V sums a player’s Win Shares and four times his Baseball-Reference WAR (For a more in-depth analysis of HOF-V, check out this article from The Bill James Handbook 2018). The target HOF-V to signify Hall of Fame worthiness is 500.

    The 2024 ballot is not fully set yet, but these will be the leading newcomers by HOF-V:

    Player HOF-V
    Adrián Beltré 747.0
    Joe Mauer 590.4
    Chase Utley 549.0
    David Wright 463.8
    Adrián González 460.0
    Matt Holliday 444.0

    Adrián Beltré is a clearcut Hall of Fame selection. He totaled 3,166 hits and 477 home runs in a 21-year career. He ranks in the top 20 in hits, doubles, total bases, and games played. His 1,781 Runs Created rank 44th all time and his 93.5 bWAR ranks 40th.

    Beltré’s 200 Defensive Runs Saved are tied with Andrelton Simmons for the most in the 20-year history of the stat. He won three Fielding Bible Awards and five Gold Glove Awards.

    Joe Mauer packed a lot into a 15-year MLB career with the Twins, playing catcher early in his career and first base in his latter seasons. He won the AL batting title three times, won the AL MVP in 2009, and finished in the top eight of the MVP voting three other times. He was a six-time All-Star who won five Silver Sluggers and three Gold Gloves.

    Mauer retired at age 35 and thus didn’t play long enough to record the cumulative totals of some other candidates, but his candidacy is viewed favorably by this system. His HOF-V is actually six points higher than Rolen’s and nearly 100 points higher than another contemporary, Buster Posey (490.7).

    Chase Utley’s HOF-V is a near match for McGriff’s 552.4. Utley totaled 64.5 bWAR (97th among position players) in a 16-year career as a second baseman for the Phillies and Dodgers. He was a six-time All-Star and four-time Silver Slugger. He was also an impactful postseason player, whose five home runs in 2009 are tied for the most in one World Series.

    Utley had a six-year peak from 2005 to 2010 in which he ranked second to Albert Pujols in Win Shares. Utley’s 123 career Runs Saved at second base rank second to Mark Ellis (130) in the 20-year history of the stat. He won a Fielding Bible Award in 2010.

    We expect fellow ballot newcomers David Wright, Adrián González, and Matt Holliday to get some degree of sentimental support (and probably Bartolo Colon too). But HOF-V does not consider such feelings. It stamps Beltré, Mauer, and Utley as Hall-of-Fame worthy and is a tool that can be used (perhaps alongside Jay Jaffe’s JAWS system) to support those candidacies. We look forward to the debate.