We know that sometimes we’ve gotten caught up in the idea that Team Defensive Runs Saved are some sort of absolute declaration pinpointing specifically how good or how terrible an MLB team is
But at a practical level it doesn’t quite work that way.
Defensive Runs Saved are theoretical. A player and his team don’t receive two Defensive Runs Saved for a diving catch on a ball with runners on second and third and two outs. Our numbers are derived from out probabilities and base/out context-neutral run values.
Also, the way Defensive Runs Saved was created was to evaluate players, not teams. Thus the combination of our use of rounding (if a player has 0.6 Runs Saved from fielding bunts, it rounds up to 1) and that team out probabilities don’t always match player out probabilities means that our numbers are good at assessing teams from top to bottom, but not necessarily exact when it comes to evaluating actual Runs Saved.
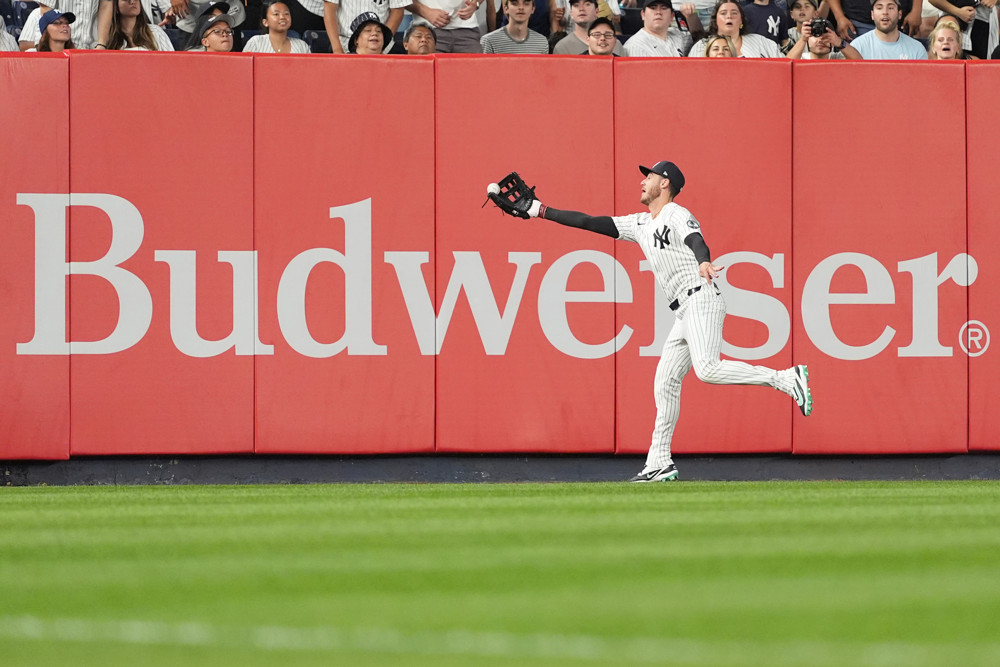
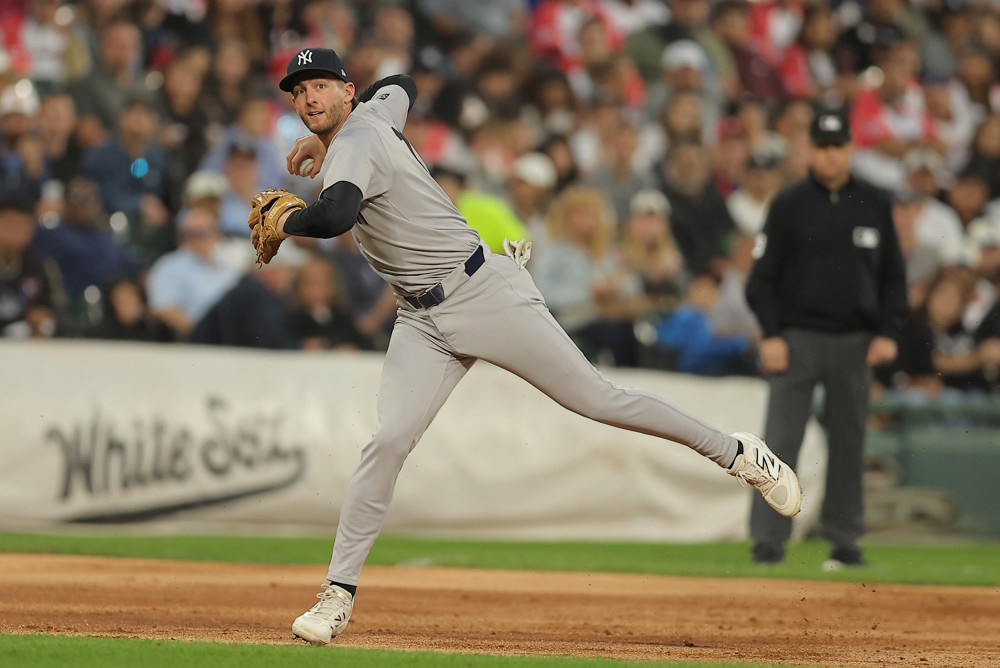
We bring all that up to get to the fun part. We wanted to look at two MLB teams from 2022 to see how much would change if their defenses were average across the board. Those teams were the No. 1 (Yankees) and No. 30 (Giants) ranked teams in Defensive Runs Saved with 129 and -53, respectively.
Strat-O-Matic, an industry leader in baseball simulations dating back to 1961 (and a client of ours), was able to help us out. They incorporate our defensive stats as one part of their player evaluations.
Strat ran 50 computer simulations* of the Yankees and Giants seasons using their pre-generated season ratings and player usage information. We’ll refer to these as the “Real Life” Yankees and Giants.
They then ran 50 simulations for both teams with every possible defensive component for every player changed to average.
*In a scientific study, we’d do 10,000 simulations but that was not practical here
Here’s how the numbers came out
2022 Yankees (50 Simulations of Each)
| “Real Life Defense” | “Average Defense” | |
| W-L | 101-61 | 94-68 |
| Runs Allowed | 583 | 642 |
| ERA | 3.31 | 3.67 |
| Opponents’ BABIP | .269 | .278 |
The Yankees team with an average defense allowed an average of 59 more runs per season and won 7 fewer games per season than their “real life” counterparts.
They still won at least 90 games in 39 of the 50 simulations (78%) and allowed an average of 4 or more runs per game 22 times (44%), including one aberrational season in which they allowed 753 runs (51 more than any other simulation).
One thing not mentioned in the chart above was the impact on catcher defense. The team with an average defense allowed 25 more wild pitches and 25 more stolen bases (though with 12 more caught stealing) then its standout counterparts.
The Yankees team from which we used real-life ratings averaged 101 wins (two more than the actual 2022 Yankees had). They won at least 100 games 30 times (60% of the time), three times as often as their average defense counterparts.
From all this, we think you can glean that the difference between being average and excellent defensively was the difference between the Yankees being a likely division winner to a near-certain one.
2022 Giants Averages (50 Simulations of Each)
| “Real Life Defense” | “Average Defense” | |
| W-L | 77-85 | 82-80 |
| Runs Allowed | 700 | 659 |
| ERA | 3.93 | 3.74 |
| Opponents’ BABIP | .316 | .298 |
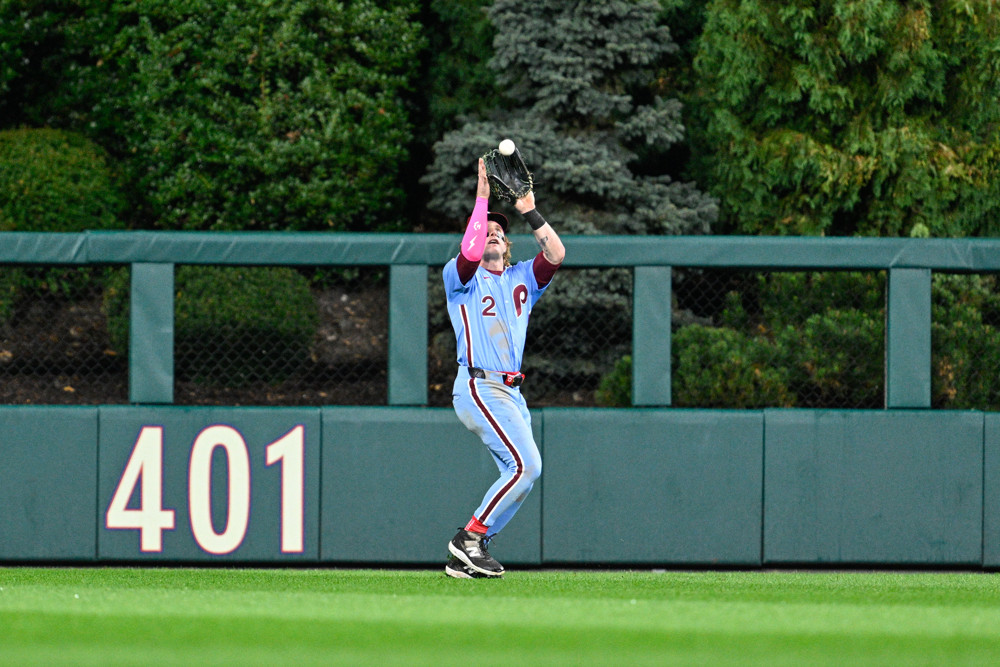
The 2022 Giants were a problematic team defensively, struggling to turn ground balls into outs for most of the season. Fly balls to left field in particular were often an adventure for Joc Pederson and others.
In looking at the results of 50 simulations of the Giants with their actual defense, they averaged 77 wins. The 2022 Giants won 81, so maybe there’s a message here that the real team overachieved a little bit.
Nonetheless, within the simulations there’s an average difference of 5 wins and 41 runs allowed between a Giants team with a bad defense and one with an average defense.
One really big improvement was that the Giants opponents’ BABIP decreased by 18 points with an average defense, which likely would have made things a lot less stressful for their pitchers. The average-defense Giants also made an average of 21 fewer errors and allowed 19 fewer stolen bases (with 2 fewer caught stealings) than their poor-performing counterparts.
The final playoff spot in 2022 (actual results) went to the 87-win Phillies. The Giants with an average defense won 87 games 10 times (20% of the time). The “real life” team with the problematic defense got to 87 wins 3 times (6% of the time).
So fair to say, the playoffs were not a likely proposition with an average defensive team. But there was a better path there than what actually existed based on their real-life numbers.
The best playoff path for the Giants was arguably the best playoff path for most teams: Be one of the better defensive teams in the sport. Nine of the top 15 teams in Defensive Runs Saved made the playoffs last season, including all six division winners.