Category: Baseball

  • Stat of the Week: Albert Pujols Finishing With A Flourish

    Stat of the Week: Albert Pujols Finishing With A Flourish

    As of July 9, the Albert Pujols farewell tour had been a dud. He was hitting .198 with a .624 OPS.

    But over the last six weeks, the Cardinals designated hitter and occasional first baseman has looked much more like he did in his prime.

    Since July 10, he’s hitting .393 with 10 home runs and 20 RBI in 84 at-bats entering Thursday’s game with the Cubs. Pujols has been particularly destructive against left-handed pitching. He’s 14-for-23 (.609) with 7 home runs against lefties since August 10.

    What Pujols has done over the last six weeks is reminiscent of what David Ortiz did in his final MLB season in 2016 (1.021 OPS, 127 RBI). Ortiz and Ted Williams in 1960 (1.096 OPS, 29 home runs) are the standard setters for farewell seasons.

    Pujols’ 10 home runs came in a 25-game span. Since 1901 (as far back as public play-by-play data allows us to search), Pujols and Barry Bonds are the only two players to hit that many home runs in that number of games after turning 42.

    As Pujols’ career enters its final weeks, here’s where he stands on baseball’s all-time lists.

    • 693 home runs (5th)
    •  2,188 RBI (2nd)
    • 3,359 hits (9th)
    • 6,153 total bases (2nd)

    The only question left among his statistical accomplishments is whether he has enough time to reach 700 home runs. He could catch Alex Rodriguez, whose 696 home runs stand 4th all-time. Pujols is also the rare player who can say his top comparable in Similarity Scores is … Willie Mays.

    As far as accolades go: Pujols has won 3 MVP awards and two World Series titles. He’s also won MLB awards named for Hank Aaron (best hitter), Roberto Clemente (sportsmanship and community involvement), and Lou Gehrig (representing Gehrig’s character and integrity).

    And as we look ahead to Pujols’ final games, we can look back too. We should remember that one reason that Pujols was able to accumulate such numbers was because of a hamstring injury that Bobby Bonilla suffered prior to the start of the 2001 season, which put him on the injured list. That allowed Pujols to make the Opening Day roster. He never played in the minor leagues again.

    Bonilla often gets celebrated in baseball circles because of the contractual agreement he had with the Mets that has him paid annually long after he retired. Perhaps he should be heralded for his role in Pujols’ career too.

    Lastly, you know how much we love defensive excellence here, so we do have to tip our cap to how Pujols played first base. Pujols has 137 Defensive Runs Saved at the position since we started tracking the stat in 2003. Mark Teixeira ranks 2nd with 92. Anthony Rizzo is the nearest active player there with 68.

    As has often been the case with Pujols, there’s nobody close to doing what he could do.

  • The Meatball: Analyzing Middle-Middle Pitches

    The Meatball: Analyzing Middle-Middle Pitches

    In the sabermetric world, analysts like to differentiate between a pitcher’s command and control. Command denotes a hurler’s ability to hit their targets precisely, their corner-nibbling prowess, while control indicates their walk-limiting capabilities.

    Most major league pitchers can throw a strike when they need to prevent a free pass. What separates the good from the great is the ability to ensure said strike is not a meatball.  

    Here at SIS, we track not only ultimate pitch location, but also where the catcher sets up prior to release. Since we don’t have data that allows us to see into the minds of pitcher-catcher batteries, this data helps us approximate their intended pitch locations.  

    And there are some clear examples of when it comes in handy. Take this 3-0 Brady Singer offering from last month that drifted over the plate, despite a target on the lower outside corner, and enabled Franmil Reyes to crush an opposite-field homer: 

    Because of the catcher’s setup, analysts can blame the miscue on Singer’s lapse in command. On the flip side, sometimes veteran pitchers like Sonny Gray have the confidence and ability to spot a fastball on the lower inside corner in 3-0 counts for swinging strikes: 


    The catcher’s glove hardly has to move an inch. For his career, Gray has a pedestrian 8.5% walk rate (league average this year is 8.2%), but perhaps he is just willing to give up the occasional walk by aiming for corner strikes—where he might not always get the call, even if he hits the target—in hitter’s counts.  

     What I’m getting at here is that while metrics like walks per nine innings and walk percentage can tell us about a pitcher’s control, catcher set-up locations can provide information about command. This way, we don’t have to assume that pitchers are trying to avoid meatball throws; we can know for sure.  

    Yet, pitchers aren’t always trying to avoid pumping a fastball down the middle. The typical example is in fact when the count is 3-0, a situation in which pitchers are known for their “get-me-over” tosses.  

    But what about other counts?  

    When do pitchers really shy away from meatballs, even if they can’t always avoid them in practice?  

    Consider the table below, which looks at pitches in the pitcher-friendliest (0-2, 1-2, 2-2), hitter friendliest (2-0, 3-0, 3-1), and relatively even counts (all others).  

    The second column describes the proportion of pitches in the specified counts for which the catcher set up down the middle. The third column indicates the proportion of pitches that the pitcher actually ended up tossing into the heart of the zone. Numbers across all combinations of rows differ by a statistically significant amount. 


    Count  Middle-Middle Set Up Rate  Middle-Middle Rate 
    Pitcher Friendliest  0.8%  4.1% 
    Relatively Even  1.2%  6.0% 
    Hitter Friendliest  1.8%  7.4% 

    If we are to take set up locations as a proxy for intended locations, it is clear that in general, the battery tries to avoid meatballs, with the catcher only setting up for one 1.1% of the time across all counts.  

    In practice, meatballs happen over five times as often as intended, but still only comprise 5.7% of all pitches. For pitcher-friendly counts, these numbers shrink to 0.8% and 4.1%, respectively.  

    The second column below details, for all pitches that actually ended up down the middle (i.e., pitches counted in the second column above), the proportion that missed the catcher’s target by more than the median miss. The third column below looks at the proportion of all pitches (not just those down the middle) that missed the target for the specified counts. 

    Count  Middle-Middle  

    Miss Target Rate 

    Overall Miss Target Rate 
    Pitcher Friendliest  58.7%  45.9% 
    Relatively Even  55.8%  50.9% 
    Hitter Friendliest  52.3%  55.4% 

    When a meatball is thrown, it seems to be a mistake more often than not, with an average of 56.1% missing the target across all counts. Non-meatballs only fell in the missed-target category 49.6% of the time, a statistically significant difference.  

    For meatballs, the only count with a missed-target rate lower than 49.6% was 3-0 (48.6%). This characterizes a general trend, as middle-middle pitches were misses significantly more often when they came in pitcher-friendly counts, compared to those in even and hitter-friendly counts.  

    This result is in spite of pitches missing significantly less often in pitcher-friendly counts overall.  

    Back to the idea of command vs. control: One of the benefits of adding “command” to the baseball analyst lexicon was that it could be pointed to as a vague explanation for why a pitcher with desirable strikeout and walk rates was failing to limit hard contact. When they missed, they missed badly, and hitters punished them. An especially bad miss in my eyes is an unintentional meatball. 

    To test this theory, I began with a model of middle-middle-miss rate as predicted by a suite of batted-ball metrics. After removing predictors that didn’t improve the model, I was left with xERA, infield-flyball rate, and Barrell%.  

    Yet, the only one that was statistically significant was xERA (in other words, the other predictors may have just been improving the model through overfitting).  

    Specifically on average, among pitchers who threw at least 500 pitches in 2021, every time unintentional-meatball rate increased by 1%, xERA increased by .08.

    This is crucial because xERA is the ERA estimator that takes quality of contact statistics most into account. 

    Interestingly, middle-middle percentage (regardless of whether they were mistakes or not) in pitcher-friendly counts was not a significant predictor of any quality-of-contact statistics, even after removing those that didn’t improve the model.  

    This serves as an important reminder that, while a majority of meatballs are unintentional, sometimes a pitcher opts to “challenge” their foe with an offering in a hittable location, a sort of catch-me-if-you-can.  

    Here, Ohtani hits the glove with 98 right down the pipe, and breakout Mariner Cal Raleigh fails to make contact: 


    If used correctly, middle-middle tosses can be yet another weapon in a pitcher’s arsenal.  

    It’s also possible that wildness can lead to middle-middle throws that surprise a hitter.  

    While not a significant predictor for either model, Barrel% did stick around for both after eliminating other predictors. Higher middle-middle rates in pitcher-friendly counts, as well as higher middle-middle-miss rates, were correlated with lower Barrel rates.  

    Thus, the answer might depend on the pitcher. Our next step as analysts should be to find the threshold of wildness under which it is worth it to nibble at the corners. 

  • Which Teams Are Positioning Their Infielders Best?

    Which Teams Are Positioning Their Infielders Best?

    One of the things that helped the Giants win 107 games in 2021 was that it seemed like for every ground ball and line drive hit against them, their infield defense was well positioned to handle it. 

    The 2022 Giants have been similarly very well positioned. In fact, by our data, they’ve again been among the best-positioned infields in the major leagues this season. 

     Most Defensive Runs Saved From Infield Positioning – 2022 Season 

    Team  DRS 
    Giants  32 
    Dodgers  32 
    Astros  24 
    Braves  22 
    Rangers  21 

    So how do we know this? 

    The way we calculate positioning value is 

    1. A) We calculate the out probability of a play using the variables available from our ball in play tracking. Those inputs for balls hit on the ground include where the ball was hit, how hard it was hit, whether the defense was shifted, and how fast the batter is.

    And then 

    1. B) We recalculate that out probability, adding the input of where the player was positioned.

    The positioning value, calculated in both plays saved and runs saved both in totality and on a per-play basis, comes from simple subtraction: B minus A. 

    So for example: 

    A ground ball up the middle may have a 50% out probability for the second baseman if we don’t know where he is positioned and presume “average” positioning. 

    But if we know where he is positioned, which for the purposes of this example can be “behind second base” we can recompute the out probability to 90%. Thus, then we know the positioning value of the play to be .4 (90% minus 50% to reflect how much the out probability improved). The run value is then computed accordingly based on where and how hard the ball was hit to account for whether the ball might have been an extra-base hit. 

    If on that same ball, the out probability went from 50% to 20% once we knew the second baseman’s positioning that would be an example of bad positioning. The team would be dinged .3 positioning plays saved (50%-20%). 

    Here’s an example of good positioning.

    The out probability of this ball if we presume average, straight-up positioning is 20%. But because of where Estrada is positioned, that probability jumps to 96%. The Giants thus get a .76 positioning plays saved credit for that, which converts to about 0.6 runs saved. 

    Teams whose positioning often matches where balls are hit rack up a lot of positive credits in this stat. Teams whose positioning doesn’t match where balls are hit accumulate lots of debits. 

    But here’s the rub with the Giants. 

    In 2021, they had excellent positioning and had solid skill at shortstop with Brandon Crawford. They had below-average skill at first base, second base, and third base, but their positioning helped covered up some of their weaknesses. 

    In 2022, the positioning’s been excellent again. Look through video and you’ll see a lot of at-em balls. But a team can be good at positioning and not do well at out-getting.  

    For the Giants, there’s been a little more of this  

    some of this 

    and a little of this  

    In 2021, the Giants turned 74.5% of ground balls and bunts into outs. That was basically a match for their expected out rate, which we calculate by compiling the out probabilities of every play.  

    In 2022, the Giants rate of getting outs has dropped to 72.4% against an expected out rate of 75.3%. In other words, for every 100 ground balls and bunts hit against the Giants, they’re getting about 3 fewer outs than expected.  

    That’s especially problematic given that the team induces the highest percentage of ground balls in MLB, a total above 1,500 for the season. 

    If the Giants had converted these balls into outs at the same rate in 2022 that they had in 2021, they’d have converted 32 more plays than they actually have. 

    The Giants have given away nearly all of their positioning advantage because their infielders aren’t getting outs. The combined Runs Saved totals of their first basemen, second basemen, third basemen, and shortstops is -32, second-worst in MLB.  

    The Dodgers leap ahead of the Giants in that stat if we rank teams on a per-play basis*. They’re not necessarily the most skilled infield defense either, but they’ve fared better overall than the Giants have.  

    * The top five teams in Infield Positioning Runs Saved are the same in the aggregate as they are on a per-play basis, just in a slightly different order. 

    The Dodgers are the most aggressive shifting team in the major leagues, as nearly 53% of balls in play against them have come against a Dodgers defense that has three infielders on the pull side and 81% of balls in play against them have come against either a full shift (three infielders on the pull side) or partial shift (two infielders deviating from normal positioning).  

    Teams that shift a lot are going to have the most opportunities to greatly impact their positioning Runs Saved because of how dramatically they alter their positioning. But they still have to shift smartly in order to garner good results over a full season. 

     That the Dodgers’ positioning has been as good as it is plays a larger role in why they are above the MLB average in turning grounders and bunts into outs at 74.8% (MLB average is 73.9%).  


    The Astros, Braves, and Rangers are the next three best teams in Infield Positioning Runs Saved. Both the Braves and Astros are of similar result patterns – a solid to standout defensive shortstop (Dansby Swanson and Jeremy Peña), with good positioning covering up any shortcomings at other spots. 

    Justin Verlander is acutely aware of how good the Astros have been. He has gotten the 4th-most positioning support in MLB and that includes plays like the one in this first clip here. 

     The Braves’ switch to a much more aggressive strategy with defensive shifts is well documented. Fair to say that they’re happy with the results this season, given that they rank 5th in the majors in turning ground balls and bunts into outs. 

    And yes, positioning helps on line drives too   

    The Rangers infield is on pace for similar overall numbers – when combining skill and positioning – as it had last season. But how they got to that total differs.  

    In 2021, the skill of players like Isiah Kiner-Falefa accounted for the majority of their Runs Saved. In 2022, with the change over to Corey Seager at shortstop and Marcus Semien at second base, the sum of the Runs Saved totals of their infielders is 0. They rate as high as they do in terms of their overall infield Runs Saved because their positioning has been better than 2021.  


    To round out this piece, here’s where every team ranks in Infield Positioning Runs Saved this season. 

    Most Infield Positioning Runs Saved  

    Team  Positioning Runs Saved 
    Dodgers  32 
    Giants  32 
    Astros  24 
    Braves  22 
    Rangers  21 
    Brewers  20 
    Mariners  19 
    Red Sox  19 
    Tigers  18 
    Diamondbacks  17 
    Padres  17 
    Blue Jays  16 
    Yankees  15 
    Angels  15 
    Twins  14 
    Rockies  14 
    Marlins  14 
    Nationals  14 
    Mets  12 
    Guardians  12 
    Phillies  10 
    Cardinals  10 
    Pirates  8 
    Rays  8 
    Cubs  7 
    Royals  7 
    Orioles  7 
    White Sox  7 
    Reds  3 
    Athletics  2 


  • Stat of the Week: Michael Harris Sparks The Braves

    Stat of the Week: Michael Harris Sparks The Braves

    By MARK SIMON

    The Braves are 50-21 with 21-year-old rookie center fielder Michael Harris II in the starting lineup this season.

    That’s a 114-win pace over 162 games and particularly impressive given that when Harris was recalled, the Braves were 22-24.

    He’s started in all but one Braves game since making his MLB debut on May 28 and is hitting .287 with a .325 on-base percentage and .500 slugging percentage. That makes him one of the leading candidates for NL Rookie of the Year.

    The Braves had a team OPS of .702 and were averaging 4.2 runs per game prior to his recall. Since May 28, their OPS is .802 and they’re averaging 5.3 runs per game. We pointed out their impressive offense in a Stat of the Week two months ago and they’ve largely sustained that success.

    This is all pertinent given that Harris, who grew up near Atlanta, just signed an eight-year contract extension worth $72 million (club options could make it a 10-year deal). He will be a long-term core player along with other teammates with lengthy deals, including Ronald Acuña Jr., Ozzie Albies, Austin Riley, and Matt Olson.

    What’s so impressive about Harris is the completeness of his game. He can hit, hit for power, run, field, and throw.

    He already has 12 home runs, matching the combined total he had in 144 games at in the minor leagues in 2021 and 2022. He’s 13-for-13 in stolen base attempts after telling us last season that he was working on getting better jumps on the bases.

    Harris ranks 7th among center fielders with 5 Defensive Runs Saved. Even with the Braves leading the Mets 13-1 on Monday night, Harris wasn’t afraid to crash into the wall to make a catch. He also had several strong throws against the Mets in their previous series.

    As Harris gets more experience, one thing to watch for is that he’s a pitch-chaser. Since his recall only three players have a higher chase rate than his 44%. He’s struck out 65 times and walked only 10.

    But Harris has shown a comfortability at the plate when in adverse counts. Eight of his 12 home runs and 14 of his 28 extra-base hits have come with two strikes. And in a limited sample with runners in scoring position, he’s hit .389 with only nine strikeouts in 54 at-bats.

    He’s also bounced back from a 2-for-24 slump in July when it looked like the league might have figured him out a little bit. He’s hitting .307 with an .863 OPS in his last 25 games.

    With no Freddie Freeman, the 2022 Braves are a bit different from the 2021 World Series champs. Yes, they still have the stars mentioned earlier in this piece, but that team was floundering until Harris came up. There are many ways a player can spark a team. Harris has done so in just about every one of them.

  • Defensive Excellence Interviews: Nelson Cooper IV, Pittsburgh Hardball Academy

    Defensive Excellence Interviews: Nelson Cooper IV, Pittsburgh Hardball Academy

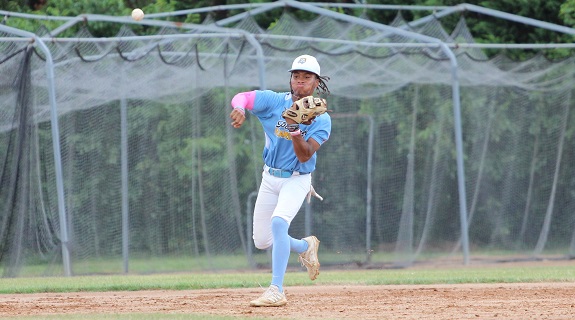
    Photo of Pittsburgh Hardball Academy infielder Brandon McClain-Banks, who is one of the program’s success stories, courtesy of Nelson Cooper IV

    This is the 3rd in a series of interviews with people who teach defensive excellence. Our previous talks were with Hawaiian high school coaching legend Dunn Muramaru and Red Sox minor league infield coordinator Darren Fenster (click on the name to read the interview).

    Nelson Cooper IV is the executive director and co-founder of Pittsburgh Hardball Academy, an organization whose goal is to remove barriers to entry while increasing diversity, equity & inclusion in baseball and softball to create positive outcomes on the field, in the community, and in life. The emphasis is on working with underserved and underrepresented kids.

    Nelson played college baseball at North Carolina Central and is a volunteer assistant coach at Division II California University (Pa.).

    Mark: Let’s start with this: What does defensive excellence mean to you?

    Nelson: The easiest way to describe defensive excellence is the ability to consistently create efficient movements that allow players to catch and throw the ball correctly. Pretty simply, we teach our kids the importance of taking every rep.

    On the field, whether it’s practice, whether it’s in the game, whatever they’re doing, we’re making sure that they’re taking efficient routes to the balls, being very efficient in their movements, and most importantly, being able to catch it and throw correctly.

    It seems pretty simple, but we tell them before when we’re warming up and when we get loose  that if we’re able to catch and throw the ball correctly in warmups, then we can translate that over to practice and then we can translate over to the games.

    Mark: What was your origin story with defense?

    Nelson: I started playing baseball when I was probably eight or nine. My mother and father met playing on my grandmother’s softball team. My mother played baseball in high school and then went on to play softball beyond high school and college. She made her high school baseball team as a middle infielder but got voted off the team by the other kids. She was a pioneer in Washington for girls in baseball. She moved to softball.

    My mom was my first coach. My mom and my grandma. My defense story started in the backyard with them hitting ground balls and throwing the ball to me.

    I’d say the most impactful defensive work and things that I’ve learned that we try to implement a lot in our program came from my time in college at North Carolina Central. We had some really good drills and really defensive work that we did during practice.

    Mark: What are the things that you’re drilling into kids?

    Nelson: The first thing we do is really making sure that the kids understand the importance of each rep that they’re taking. We prefer for them to take high-level reps, fewer high-level reps than a massive amount of reps.

    When we step on the field, we have all of our players line their gloves up on the line. Not because that means anything in terms of defensive excellence. However, I do think it means something in terms of discipline.

    And we drill this to our kids: Take those reps when you’re warming up and instead of just kind of tossing aimlessly, really practice to make sure you’re throwing accurately with proper mechanics.

    About Pittsburgh Hardball Academy

    * Founded in 2020 by Nelson Cooper IV and Brian Jacobson
    * Program run primarily by volunteer coaches
    * Created to make high-level baseball more accessible to low-income families
    * Alumni are playing at junior colleges, NAIA, and NCAA schools

    Then, as the receiver of the ball, we have them implementing some sort of athletic game-like movement into their throwing routine. So if one player is  throwing and just getting loose, that guy catching a ball or receiving the ball can move their feet like they’re taking a relay and throw through, or they can catch the ball and put a tag down.

    We make sure every time we throw a ball on the field, it’s thrown with intent. That’s a big word in our program. We want them to make sure that there’s intent in all of their actions, even from starting our warmups.

    We do drill work every day. So if it’s a pick series, if it’s just fielding the ball, getting to a proper throwing position to ensure that kids have their weight properly distributed after they field the ball, if it’s funneling the ball, if it’s throwing overheads to outfielders, making sure they’re taking proper routes, catching the ball, shuffling their feet, all those different things.

    The one thing that we always like to end with after doing regimented drill work or  regimented positional work is some fun aspect of the defensive practice.

    One thing that’s been very successful for us, and I think the kids really like it, is trying to have 5-10 minutes at the end of all of that drill practice to make highlight plays or Web Gems.

    So we’ll hit balls that are either unreachable or very difficult, encourage the kids to lay out for a ball or to try something new to field it. We try to make the highlight plays more routine. So the more that you’re able to make those highlight plays in practice, the more when those unexpected situations come in the game that it becomes a routine play for the players.

    Baseball can be. challenging and very mentally draining. But if you give them the space to have a little bit of fun in the game, I think they can really grow and become great defenders. We tell our kids that if they limit their mistakes in high school, they’re gonna win games.

    Mark: What are the things that the younger players have the hardest time picking up?

    Nelson: Sometimes we have kids that are starting at 15 or 16 years old that haven’t had the skill or the development training from a very young age.

    They’re going from more of a recreational background into a travel organization. It’s a kind of a jump for them. I think the biggest thing some kids struggle with is knowing the pace of the game.

    You don’t have to be super quick to make plays. You don’t have to go very fast. You just need to be efficient in your movement.

    So you don’t have to sprint out the ball and run through it and make a throw on the run every time. But you have to be able to read the ball, read the runner, and know how to stay under control and move as quickly as you can within the constraints of your body.

    So if you’re super athletic, maybe you can move a little bit quicker than someone who’s not. But being able to utilize your body as efficient as possible, doesn’t mean you have to always go as fast as possible. But that also doesn’t mean you want to go very slow and methodical.

    So I think it’s difficult for kids to understand that, particularly coming from the background that they are. We try to work through those things, and we tell them over and over that you want to work quickly. You want to be able to attack the ball, get into good positions, but you need to stay under control, have some body control and make sure you control your movements on the field,

    Mark: Is that a hard thing to teach given that a lot of these kids are still going through physical growth?

    Nelson: Oh yeah. It’s way easier for me to say that than it is for them to actually execute it.

    We’ve had some kids now that we started with that started at 13, now they’re 17, 18, and you can see over time, consistent messaging, consistent practice allows those kids to be able to develop those skills.

    I think that’s the hardest thing with baseball compared to some of the other sports. You have to be able to rein in your athleticism at times and be able to use it in controlled movements.

    Mark: Are there any things that have happened recently that articulate good lessons in defensive excellence?

    Nelson: I’ll give you a good example of blending the two things that we that we were just talking about, the reining in the athleticism part.

    One just happened about a week ago. We have a 13-year-old-kid and the first time I saw him field, I was like ‘This kid’s gonna be special.’

    He had the natural ability to chop his feet to slow down to field the ground ball while still moving through it and putting his feet in good position. There’s a ground ball hit to him and he bobbled the ball.

    We usually teach our kids that if they bobble the ball to pick it up and do a full-arm fake to see if they could try to get another runner out. If you full-arm fake, you might be able to catch a runner off guard.

    Well, this very athletic kid bobbled the ball, picked it up and just immediately went into like a Derek Jeter jump throw across the infield with the batter almost at first base.

    He made a throw that was right on the money. Maybe it wasn’t the best decision to make the throw, so a learning moment for him, but a learning moment for us as coaches, as I would never have known that the kid could make that play if he didn’t make it in practice.

    I think that’s one thing that we can learn from coaching: Let them be athletic to a certain extent and see what they can do, but obviously try to rein in and put it in the most efficient package as possible.

    Mark: If you could fix something about what kids are taught with regards to playing defense, what would that be?

    Nelson: I would have kids be more aggressive defensively at a younger age. A lot of times, particularly in the outfield, you see kids run up to the ball and they just let it drop at their feet instead of leaving their feet to try to slide and make a catch. And I think it comes from the shock of maybe a time when they dove for it and it got past them and went to the fence.

    Kids are definitely gonna make errors. Pros, make errors, everybody makes errors. But there should be a space for kids to really understand that they can still be aggressive to the ball. Teach that from a young age, that even if you make that mistake, you still have to stay aggressive because the only way to really consistently make outs is to be aggressive to the ball.

    Mark: What about the idea of letting athletes be athletes?

    Nelson: You can’t just let kids run wild on the field. But I think you should make space to allow those higher-level players or those more athletic players to try to make great plays when necessary. If that ball is way up the middle and the only way you can make that plays to lay out or to dive or try to pick through it or do something, great, do it. However, on routine balls, let’s just make the routine play.

    And I’ve always said, you don’t need to be flashy. The flashiest thing to a scout or to a coach is a high fielding percentage.

    And then once we’re able to conquer or master the easy, then we can move on to the next thing.

    Mark: How are you doing and how are the kids doing for resources?

    Nelson: We always we always are looking for additional resources. I think we’ve been able to develop some pretty high-level infielders. A lot of that is because of the public parks we use in Pittsburgh, where we’re grateful to be able to permit the fields.

    But some of the kids don’t have a choice: either catch the ball or get hit by it. You can’t move out of the way of a ground ball because a coach will yell at you. So you better figure out a way to catch it.

    I think field access and field quality builds a little bit of character for our kids and the character of our program.

    We’re a non-profit organization. Brian Jacobson and I started this organization a few years ago to give more access and opportunity to kids who otherwise may not have had it, particularly underserved kids.

    Our kids are highly diverse with a majority being African American.. African Americans are severely underrepresented in baseball.

    We’ve also had situations from parents who reached out and said ‘We have financial resources and we’re willing to help the organization. We want our kids to grow up in a diverse environment with diverse friends.’ And that has been a blessing for our organizations.

    Our program is pretty much Brian and I, and primarily run by volunteer coaches. We’re able to work with more than 100 kids a year through this program.

    We’re always looking to partner with other organizations, always looking for donations, either financial or equipment, or sponsorships as well for our organization to help, continue to grow and be able to impact kids in the greater Pittsburgh region.

    Since starting the program in 2020, we’ve had more than 25 kids have the opportunity to continue their academic and athletic careers at the collegiate level. So it’s a really neat program and we’re always looking for people or organizations that can help us grow our mission

    To learn more about Pittsburgh Hardball Academy, visit PittsburghHardball.org. Portions of this interview have been edited for clarity and length.


  • KBO Scouting Report: Eui-lee Lee

    KBO Scouting Report: Eui-lee Lee

    Despite not being known as a league with great pitching, the subset of players who have transitioned best from the KBO to MLB are left-handed pitchers. Last season Hyun-jin Ryu, Kwang-hyun Kim and Hyeon-jong Yang all pitched for MLB teams.

    Unfortunately for the South Korean national team, that meant all three of those pitchers were unable to participate in the Olympic baseball tournament last summer. Add in that the top KBO lefty, Chang-mo Koo, missed the whole season with injury, South Korea had to dig deeper for a left-handed pitcher to add to their staff.

    It was still surprising to see Eui-lee Lee of the Kia Tigers be named to the team, as he had just turned 19 less than two months before the Olympic tournament started. But he held his own against both the Dominican Republic and the United States.

    That showing was impressive for a teenager, and Lee has continued to perform well in the KBO. For his career he has a 3.86 ERA, and is averaging roughly a strikeout per inning in a league in which pitchers typically strike out about 7 batters per 9 innings. His 4.07 ERA in 2022 is right around the KBO average of 4.05. 

    It is unclear if he will be part of the South Korean team at next spring’s World Baseball Classic as Kim, Yang and Koo should all be available, but he is a name to keep an eye on.

    What are the keys to Lee’s success?

    By KBO standards, he is a power arm, averaging 91 MPH on his fastball which makes him one of the harder left-handed throwers in the league. He leverages that advantage by using his fastball 64% of the time, and it is the pitch he can locate best, getting strikes on 69% of his them.

    He will often sit around 92 with the fastball in his starts, but he will occasionally lose some velocity deeper into games.

    Lee has also proven to be adaptable, and is still refining his secondary pitches, though the results are encouraging 

    Pitch Avg Speed Usage % Whiff % Whiff % vs RHB/LHB
    Curveball 78 13% 31% 40%/20%
    Slider 82 12% 38% 50%/33%
    Changeup 84 11% 42% 43%/0*

    *Only 2 changeups thrown to left handed batters this season with 1 swing against.

    His secondary offerings are still works in progress, though it is interesting to note he has better whiff rates versus right handers on all four of his pitches.

    His curveball has good shape, and he has improved his confidence with the pitch. He threw only 9 curveballs over his first 5 starts, but it has become his most trusted secondary pitch this summer.

    His slider will sweep across the zone, and he tends to use it in favorable matchups, with the usage of the pitch varying drastically from start to start.

    The changeup was his go-to secondary offering to start the season, as he threw 68 over his first 4 starts. He has cut his changeup usage since then but, like with his slider, he will vary the usage depending on matchups.

    The changeup has improved during the season in terms of shape as well. Early on, it was very straight, essentially looking like a slower version of his four-seam fastball. He has added some fade to the pitch as the year has progressed.

    Where can he improve?

    Lee’s success is due largely to the quality and power of his pitches, and how he plays them off each other. As he gets older and continues to develop, he will need to get better at locating his pitches.

    I already mentioned that his fastball is his best pitch for getting strikes, at 69%. Despite the big whiff rates on his secondary pitches, he still struggles to get strikes with them. 

    All of his secondary pitches result in strikes 60% of the time (the slider) or less (curveball and changeup both have a 52% strike rate). By comparison, MLB strike rates are 63% for sliders, 61% for curveballs and changeups.

    A lot of his balls thrown are non-competitive pitches as well, and what jumped out the most to me on video was the number of pitches he throws in the dirt.

    First, a look at the pitchers with the most pitches that have not reached home plate:

    Most Pitches Bounced in Front of Home Plate – KBO
    Eui-Lee Lee Kia Tigers 44
    Min-woo Kim Hanwha Eagles 39
    Woo-jin An  Kiwoom Heroes 32
    Hyeon-jong Yang Kia Tigers 31
    Je-seong Bae KT Wiz 29

    Obviously some pitches in the dirt are intentional, particularly breaking balls in two-strike counts. But looking at breaking balls in the dirt shows where his command issues are most obvious. 

    KBO Percentage of Non-Fastballs Thrown in Dirt
    Eui-Lee Lee Kia Tigers 22%
    Casey Kelly LG Twins 17%
    Je-seong Bae KT Wiz 17%
    Eric Jokisch Kiwoom Heroes 16%
    Hyeon-jong Yang  Kia Tigers 16%

    *Note for this leaderboard “in dirt” can refer to pitches that bounce before or on/after the plate

    What does it all mean?

    Overall, Eui-lee Lee is still one of the better pitchers in the KBO, even with his ERA being what it is. His power from the left side overpowers hitters, regardless of the location of his pitches. Lee is one of only four KBO pitchers with 80 innings pitched who is averaging more than a strikeout per inning, with the others being Woo-jin An, Drew Rucinski, and Glenn Sparkman.

    He is still very young, and has shown that he is still developing as he works on his secondary pitches. He has the opportunity to be an elite KBO starter if he can improve his control.

    Despite his wildness, his walk rate has dropped from 14% last season to 9% in 2022. My theory is that as his stuff improves and he adds some velo while he fills out, hitters will cheatmore to catch up to the fastball, and are more prone to chasing bad pitches when they guess wrong. But then as hitters adapt, his walk rate will likely start to climb again.

    Even if his control does not improve, he could still have a solid career as a mid-rotation power pitcher in the KBO, and his power stuff gives him a chance to be a high-end bullpen arm for both Kia and the National Team for years to come.

  • Stat Of The Week: Aaron Judge’s Amazing Stretch … And Season

    Stat Of The Week: Aaron Judge’s Amazing Stretch … And Season

    By MARK SIMON

    “Oh what a sock it was!”

    “It was one of the sockiest socks we ever saw.”

    Those are the words from the person who wrote the game story in the New York Daily News for the Yankees’ 4-3 win over the Tigers on May 26, 1920 (there’s no byline, so they are forever anonymous to us). They were describing a mammoth home run hit by Babe Ruth (click here to see it in newsprint).

    Ruth’s 60 home run season in 1927 is often acknowledged as one of the best seasons in baseball history. But Ruth’s 1920 actually surpasses it. He hit .376 with an .847 slugging percentage, the latter an MLB record that stood until Barry Bonds surpassed it in 2001 .

    Within that season, Ruth had many incredible stretches.  We want to focus on one that had a lot of socky socks. Over 21 games from May 11 to June 7, Ruth had 33 hits, 6 doubles, 3 triples, and 13 home runs. He slugged 1.183. It’s the best single-season slugging stretch in Yankees history.

    “You never can tell when a man hits his batting stride,” Ruth wrote in a column alongside that game story.

    It’s a stretch that is topped since 1901 only by ones from Bonds in 2004 (thanks, Baseball-Reference!).

    We bring that up in light of Aaron Judge and the amazing season that he’s having. He hasn’t quite been Ruthian, but he has been ridiculous.

    He has an MLB-leading 45 home runs, including 14 in his last 21 games, a run that started with two home runs in a 14-1 win over the Red Sox. His slugging percentage in those games is 1.052.  The only Yankees with better 21-game stretches are Ruth (many instances) and Lou Gehrig (once).

    Look at this statline!

    Aaron Judge’s Last 21 Games  

    Category Stat
    Batting Average .434
    On-Base Percentage .561
    Slugging Percentage 1.053
    Home Runs 14
    RBI 33

    Let’s add in that Judge is playing a premium position in center field and doing it credibly in his final season before free agency. He’d be a candidate for his second straight Fielding Bible Award had circumstances not dictated his move off right field (he could move back to right field when new acquisition Harrison Bader comes off the injured list).

    The long-ago developed stat Offensive Winning Percentage is one we like to dust off every now and then to celebrate a player’s excellence. It calculates how a team would fare if it had nine of that player in their lineup, with average defense and average pitching.

    A team of Aaron Judge’s would win 82% of its games (we’d like to meet the team it would lose to!).

    Judge and Paul Goldschmidt are dueling for the No. 1 spot in that stat this season. Judge currently leads by one-tenth of a percentage point (82.4 to 82.3). They’ve both been amazing, but this current run by Judge has been just otherworldly. By the way, he also easily leads MLB in another Bill James-crafted stat, Win Shares, with 30.

    Admittedly Judge’s stats look a little meager compared to some of Ruth’s best seasons, and we say meager with a chuckle because Judge doesn’t look meager next to anybody.  He’s a giant among men in MLB right now. Or as the Daily News could say, he’s the sockiest socker in the game.

  • Spot on: The best positioned outfields in MLB

    Spot on: The best positioned outfields in MLB

    Which are the best positioned teams in baseball?

    For a long time it was hard to answer that question because the data didn’t exist.

    But in 2022, thanks to the work of our Video Scouts who chart every play of every game and the availability of better quality video, we’re able to look into such things.

    So we’re going to look at positioning in this article, which will focus on outfield, and another, which will look at infield positioning.

    The top teams in outfield positioning this season are listed below.

    Team OF Positioning Runs Saved
    1. Blue Jays 17
    2. Red Sox 12
    3. Tigers 9
    4. Mariners 8
    5. Rockies 7

    Before we look at each of them specifically, let’s first explain the methodology.

    Methodology

    The way we calculate positioning value is

    A) We calculate the out probability of a play using all of the variables available from our tracking. Those inputs for balls hit in the air include where the ball was hit, how hard it was hit, where the player was positioned.

    And then

    B) We recalculate that out probability taking away the input of where the player was positioned and replacing it with “average positioning.”

    The positioning value, calculated in both plays saved and runs saved both in totality and on a per-play basis, comes from simple subtraction: A minus B.

    So for example:

    A fly ball into the left center gap may have a 50% out probability for the center fielder if we don’t know where he is positioned and presume “average” positioning.

    But if we know where he is positioned and can recompute the out probability to 90%, then we know the positioning value of the play to be .4 (90% minus 50%). The run value is then computed accordingly based on where and how hard the ball was hit to account for whether the ball would be an extra-base hit.

    That would be an instance of good positioning.

    If on that same ball, the out probability went from 50% to 20% once we knew the center fielder’s positioning, that would be an example of bad positioning. The team would be dinged .3 positioning plays saved (50%-20%).

    Good teams rack up a lot of positive credits in this stat. Bad teams accumulate lots of debits.

    Let’s run through each of the teams in the Top 5.

    Blue Jays

     The team that best positions its outfielders, both on a per-opportunity basis and overall, is the Blue Jays. Both Mike Petriello and David Adler have written about the Blue Jays aggressive outfielding on MLB.com.

    Mike’s right, by the way. The value add is likely coming in the traditional three-man outfield rather than the now 135 balls in play against a Blue Jays four-man outfield (on which the BABIP is .346).

    The Blue Jays have found the right formula when using three outfielders. They’ve gotten the results they’ve sought.

    If we combine the Blue Jays outfielders Runs Saved specific to range with the team’s Runs Saved for outfield positioning, that’s a combined 12 Runs Saved.

    Last season, those two numbers combined for -2 Runs Saved.

    They’re 14 Runs Saved better in the outfield this season specific to catching balls.

    And it’s part of a larger theme here. The Blue Jays rank third in Defensive Runs Saved overall behind only the Yankees and Dodgers.

    And they’re among the top defensive outfields when combining all aspects of play (making plays, throwing, etc)

    Most Defensive Runs Saved – Outfields

    Team Runs Saved
    Astros 28
    Tigers 23
    Blue Jays 18
    Guardians 18
    Orioles 17

    What’s cool about the outfield info is that we can pinpoint plenty of instances in which their aggressive positioning paid off.

    This is the best example:

    This one’s a good one too.

    Our system is such that it rewards good decision making even without the recording of an out. This play is a good example of this. George Springer would have had no chance at this ball unless he was playing well over to the pull side.

    The Blue Jays don’t have outfielders with great histories of skill in the corner spots with Lourdes Gurriel Jr. and Teoscar Hernandez, but Springer does have a good track record. And sometimes the combination of athleticism and positioning makes improbable plays possible.

    This play has a 13% out probability if we don’t know the fielder’s positioning and a 58% out probability once we do. Springer still has to do considerable work on this ball to make the catch. He and the team are basically equally rewarded.

    Red Sox

    The Red Sox have taken a tumble but their outfield positioning has been on point this season. Here’s an instance of positioning and skill coming together early in the season when Alex Verdugo turned the tables on the Blue Jays and robbed Santiago Espinal on a tricky line drive.

    This play had a 14% out probability before considering positioning. The Red Sox placing Verdugo where they did bumped it to 56%. And Verdugo did the rest to push it to 100% and an out.

    By the way, here’s something notable related to using positioning to get results.

    The Blue Jays have gotten 18 outs on the 25 balls on which positioning increased their chance of making the out by 50%.

    In the Red Sox case, good positioning doesn’t always get rewarded. Their outfielders have converted 5 of 14 balls on which positioning helped by 50%.

    For more on the Blue Jays specific to four-man outfield use, we suggest you also check out David Adler’s piece on MLB.com

    Rockies and Tigers

    Two teams in big home ballparks are doing their best to give their outfielders a chance to make plays.


    In the Tigers’ case, it’s working. Overall, their outfielders have converted 63% of fly balls and line drives into outs this season, the fifth-highest rate in the majors, and up 3 percentage points from last season. Their outfielders rank second in MLB in Defensive Runs Saved.

    For the Rockies, there’s only so much they can do. Even with stellar positioning, they rank 29th in turning flies and liners into outs (54%). And their outfielders rank 23rd in Runs Saved.

    Mariners

    We could point out some examples of sound play by the Mariners outfield, but instead I want to use this one to make a different point of how positioning data factors into our stats.

    Though this was a diving catch by Mariners left fielder Jesse Winker, our system calculated that the out probability on this ball increased from 25% to 93% because of where the Mariners positioned Winker.

    Winker’s path to the ball was not direct. Statcast had it as 3 feet worse than average in the first 1.5 seconds the ball was in the air (in his defense, perhaps the spin on it made for a tough read).

    Regardless, this becomes a play on which the team gets the bulk of the credit rather than the player, even though the player made a tough-looking catch. It’s a good example of a play that shows why we chart positioning at all.

    More to come in our next piece, which will look at infields.


  • Want To See Good Defense? Watch Christian Walker Field … and Hit

    Want To See Good Defense? Watch Christian Walker Field … and Hit

    Diamondbacks first baseman Christian Walker is having the ultimate defensive season – the combination of his work as both a fielder and as a hitter.

    We know that’s an odd thing to say but Walker’s statline has produced a highly unusual year.

    Walker’s Defense

    Let’s start with the obvious, his defensive numbers are great.

    Walker has 15 Defensive Runs Saved as a first baseman this season. He is the runaway leader. No one else has even half as many at the position.

    Most Defensive Runs Saved – First Basemen

    Name Runs Saved
    Christian Walker 15
    Vladimir Guerrero Jr. 6
    C.J. Cron 4
    Josh Bell 4

    What separates Walker from his positional peers is his range, which accounts for all 15 of his Runs Saved, specifically the skill he has at handling a ball hit to his right.

    He has converted 67 of 123 plays on balls hit in that direction in which he had a >0% chance of recording the out. He is the only first baseman at 50% or higher in that stat and is more than 10 percentage points better than anyone else with at least 50 such opportunities. Walker’s expected out rate on these plays is 46%, so he’s 9 percentage points better than average.

    By comparison, Matt Olson, a past Fielding Bible Award winner, is 57-of-143 – that’s 10 fewer plays made on 20 more opportunities.

    Walker can make these plays both standing upright and diving when necessary. Case in point:

    But Walker is also a standout on balls hit to his left, turning 49-of-57 into outs, an 86% out rate against an expected out rate of 79% and 49-of-56 on what we define as “middle” (balls in which he didn’t have to go in either direction), 88% against an expected out rate of 80%.

    Walker’s Hitting

    This might sound weird but the defense that other teams have played against Christian Walker … it’s as good as the defense that Walker has played against other teams.

    Walker is hitting .201 with a .449 slugging percentage this season.

    SIS has the ability to calculate expected stats based on where players hit balls and how hard they hit them. Walker’s expected batting line this season is  .254 with a .554 slugging percentage.

    Walker has 19 fewer hits than expected.

    Defenses have 14 Runs Saved against him in terms of turning batted balls into outs (13.5 to be exact). The only players that defenses have saved more runs against are Corey Seager (14.2) and Whit Merrifield (13.7).

    One element of Walker’s numbers not being where they could be is in how teams are defensing him. Walker, a right-handed hitter, has had more at-bats come against defensive shifts than ever before.

    And those shifts have crushed his batting average – he’s 3-for-40 when hitting a ground ball or a short line drive against a fully shifted defense (3 infielders on the pull side). As such, his ground ball numbers are nowhere near his career norms.

    Batting Average on Ground Balls – Christian Walker

    Season Batting Avg Hits
    2019 .250 39
    2020 .260 19
    2021 .267 31
    2022 .156 17

    But it’s not just the positioning of the defense that has vexed Walker. It’s something entirely out of his control – the skill of the defenders.

    Opposing players have 11 “Good Fielding Plays” against Walker related to taking away a base hit. That’s tied for most in the majors.


    Walker’s done his part to deal with this, barreling up balls like never before. He’s now hit 25 home runs, not far from his career high of 29. His OPS+ is better than league average and comparable to his past seasons. He’s a productive hitter even with a low batting average

    But he probably deserves at least better with that home run total too. Arizona has the lowest Park Factor for home runs in the majors. There have been 93 home runs hit there, compared to 137 in Diamondbacks road games.

    Walker’s 25 home runs come along with an xHR of 31.


    And it can happen to him on the road too. It just did – a ball that would have been a home run in 24 ballparks (per Statcast) was not one in Atlanta.


    As Diamondbacks broadcaster Steve Berthiaume said, Walker can’t believe it. It’s been the story of his season. Those hitting balls in his direction know the feeling too.

  • Stat of the Week: Notable Outfielders Dealt At Deadline

    Stat of the Week: Notable Outfielders Dealt At Deadline

    BY MARK SIMON

    Those who cover MLB are calling the Juan Soto trade among the biggest in baseball history, with the Padres acquiring a generational talent and sending the Nationals the top players in their farm system in return.

    And while it’s likely that Soto’s bat will have a huge impact, not just on this pennant race but on the next two, we like to look at things through a defensive lens here.

    For his career, Soto is an average defensive right fielder. It’s seemingly the only aspect of his game that could be called average. Soto has exactly 0 Runs Saved in a little more than 2,100 innings. He saved 4 runs with his right field defense last season but has dropped to -3 so far in 2022.

    The 2021 version of Soto would be about a match for the Padres’ current standing in right field (2 Runs Saved), but the 2022 version of Soto is a little bit of a drop off.

    Soto has 19 Defensive Misplays & Errors in right field in 2022, the most of anyone at the position and two more than he had in 2021. On a per-inning basis, he has the 6th-highest rate of Misplays & Errors among the 35 right fielders that have played the most innings.

    The Padres can live with that because they know that his bat will go way above and beyond in making up for it. They also landed another big bat, first baseman Josh Bell. Bell, who cost his team 25 runs with his defense from 2016 to 2019, has a career-high 3 Runs Saved there in 2022.

    Other teams made moves for outfielders from whom good defense will be essential. The Yankees traded pitcher Jordan Montgomery to the Cardinals for center fielder Harrison Bader.

    Bader just missed out on winning the Fielding Bible Award last season, after recording his second season with 15 Runs Saved in center field. He’s currently out with a foot injury and hasn’t played since late June.

    When healthy, he’ll be rejoining a team that currently ranks first in the majors in Defensive Runs Saved. It’s biggest defensive weakness? Center field (-6 Runs Saved).

    The Phillies made a move with the intention of bettering a defense that ranks tied for 27th in Runs Saved, snagging Angels outfielder Brandon Marsh. Marsh ranks second in left field with 7 Defensive Runs Saved this season.

    He’ll likely switch to center field, where his history isn’t as good (-3 Runs Saved), though he may be better than what the Phillies already have there (only two teams are worse than their -7 Runs Saved).

    A study by our former research associate Andew Kyne showed that outfielders decline by about 7 runs per 1,000 innings when moving from a corner spot to center field. Remember that when evaluating Marsh, who wasn’t the only move the Phillies made to better their defense. They also traded for Cardinals infielder Edmundo Sosa (13 Runs Saved in 737 career innings at shortstop).

    Two of the best defensive players dealt were traded in deals involving the Rays. With Kevin Kiermaier out for the season, Tampa Bay got involved in a three-way trade with the Astros and Orioles, netting center fielder Jose Siri after trading for Diamondbacks left fielder David Peralta.

    Siri ranks second in Defensive Runs Saved at that position this season and made a terrific catch in his Tampa Bay debut. Peralta won a Fielding Bible Award in 2019 but basically rates average at the position since then (-1 Run Saved from 2020 to 2022).

    With Siri’s acquisition, the Rays traded Brett Phillips to the Orioles for cash. Phillips had below-average numbers in center field in 2022 (-4 Runs Saved), but ranks tied for 3rd with 8 Runs Saved in 235 innings in right field. He has a history of defensive excellence in limited playing time and will be outfield depth for an Orioles team whose outfield has played well this season.

    Lastly, one player that wasn’t traded was versatile Marlins infielder Joey Wendle. Wendle won our Defensive Player of the Month award (determined by SIS staff voting) for July. He’d have been an interesting pickup for any number of teams looking for help. But for now, he stays with the Marlins.

    Wendle was a defensive difference maker for the 2020 Rays, helping them advance to the World Series. This October (and November) he’ll be watching players make great plays at home. Maybe even one by a player dealt at the deadline.

    For more on the trade deadline, check out the SIS Baseball Twitter.