In the sabermetric world, analysts like to differentiate between a pitcher’s command and control. Command denotes a hurler’s ability to hit their targets precisely, their corner-nibbling prowess, while control indicates their walk-limiting capabilities.
Most major league pitchers can throw a strike when they need to prevent a free pass. What separates the good from the great is the ability to ensure said strike is not a meatball.
Here at SIS, we track not only ultimate pitch location, but also where the catcher sets up prior to release. Since we don’t have data that allows us to see into the minds of pitcher-catcher batteries, this data helps us approximate their intended pitch locations.
And there are some clear examples of when it comes in handy. Take this 3-0 Brady Singer offering from last month that drifted over the plate, despite a target on the lower outside corner, and enabled Franmil Reyes to crush an opposite-field homer:
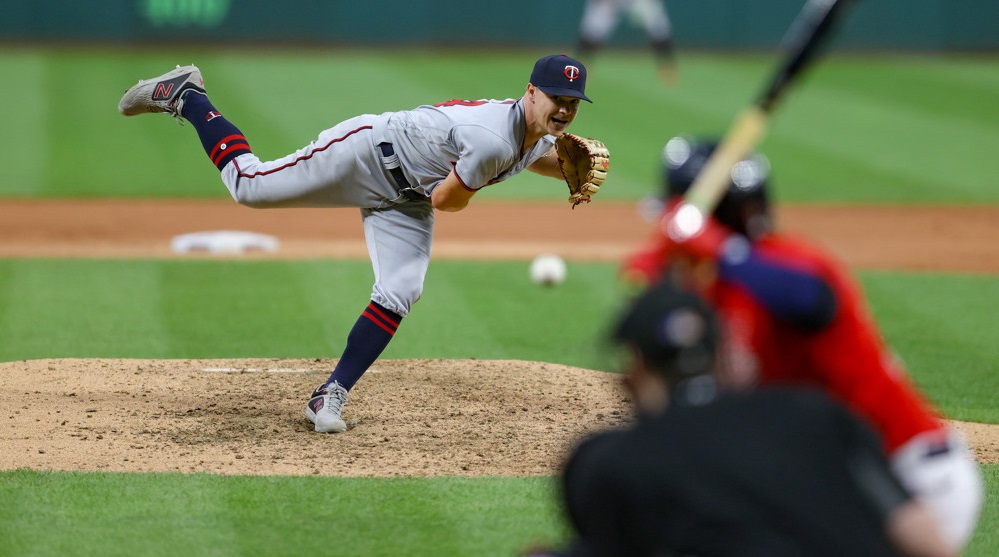
Because of the catcher’s setup, analysts can blame the miscue on Singer’s lapse in command. On the flip side, sometimes veteran pitchers like Sonny Gray have the confidence and ability to spot a fastball on the lower inside corner in 3-0 counts for swinging strikes:
The catcher’s glove hardly has to move an inch. For his career, Gray has a pedestrian 8.5% walk rate (league average this year is 8.2%), but perhaps he is just willing to give up the occasional walk by aiming for corner strikes—where he might not always get the call, even if he hits the target—in hitter’s counts.
What I’m getting at here is that while metrics like walks per nine innings and walk percentage can tell us about a pitcher’s control, catcher set-up locations can provide information about command. This way, we don’t have to assume that pitchers are trying to avoid meatball throws; we can know for sure.
Yet, pitchers aren’t always trying to avoid pumping a fastball down the middle. The typical example is in fact when the count is 3-0, a situation in which pitchers are known for their “get-me-over” tosses.
But what about other counts?
When do pitchers really shy away from meatballs, even if they can’t always avoid them in practice?
Consider the table below, which looks at pitches in the pitcher-friendliest (0-2, 1-2, 2-2), hitter friendliest (2-0, 3-0, 3-1), and relatively even counts (all others).
The second column describes the proportion of pitches in the specified counts for which the catcher set up down the middle. The third column indicates the proportion of pitches that the pitcher actually ended up tossing into the heart of the zone. Numbers across all combinations of rows differ by a statistically significant amount.
| Count | Middle-Middle Set Up Rate | Middle-Middle Rate |
| Pitcher Friendliest | 0.8% | 4.1% |
| Relatively Even | 1.2% | 6.0% |
| Hitter Friendliest | 1.8% | 7.4% |
If we are to take set up locations as a proxy for intended locations, it is clear that in general, the battery tries to avoid meatballs, with the catcher only setting up for one 1.1% of the time across all counts.
In practice, meatballs happen over five times as often as intended, but still only comprise 5.7% of all pitches. For pitcher-friendly counts, these numbers shrink to 0.8% and 4.1%, respectively.
The second column below details, for all pitches that actually ended up down the middle (i.e., pitches counted in the second column above), the proportion that missed the catcher’s target by more than the median miss. The third column below looks at the proportion of all pitches (not just those down the middle) that missed the target for the specified counts.
| Count | Middle-Middle
Miss Target Rate |
Overall Miss Target Rate |
| Pitcher Friendliest | 58.7% | 45.9% |
| Relatively Even | 55.8% | 50.9% |
| Hitter Friendliest | 52.3% | 55.4% |
When a meatball is thrown, it seems to be a mistake more often than not, with an average of 56.1% missing the target across all counts. Non-meatballs only fell in the missed-target category 49.6% of the time, a statistically significant difference.
For meatballs, the only count with a missed-target rate lower than 49.6% was 3-0 (48.6%). This characterizes a general trend, as middle-middle pitches were misses significantly more often when they came in pitcher-friendly counts, compared to those in even and hitter-friendly counts.
This result is in spite of pitches missing significantly less often in pitcher-friendly counts overall.
Back to the idea of command vs. control: One of the benefits of adding “command” to the baseball analyst lexicon was that it could be pointed to as a vague explanation for why a pitcher with desirable strikeout and walk rates was failing to limit hard contact. When they missed, they missed badly, and hitters punished them. An especially bad miss in my eyes is an unintentional meatball.
To test this theory, I began with a model of middle-middle-miss rate as predicted by a suite of batted-ball metrics. After removing predictors that didn’t improve the model, I was left with xERA, infield-flyball rate, and Barrell%.
Yet, the only one that was statistically significant was xERA (in other words, the other predictors may have just been improving the model through overfitting).
Specifically on average, among pitchers who threw at least 500 pitches in 2021, every time unintentional-meatball rate increased by 1%, xERA increased by .08.
This is crucial because xERA is the ERA estimator that takes quality of contact statistics most into account.
Interestingly, middle-middle percentage (regardless of whether they were mistakes or not) in pitcher-friendly counts was not a significant predictor of any quality-of-contact statistics, even after removing those that didn’t improve the model.
This serves as an important reminder that, while a majority of meatballs are unintentional, sometimes a pitcher opts to “challenge” their foe with an offering in a hittable location, a sort of catch-me-if-you-can.
Here, Ohtani hits the glove with 98 right down the pipe, and breakout Mariner Cal Raleigh fails to make contact:
If used correctly, middle-middle tosses can be yet another weapon in a pitcher’s arsenal.
It’s also possible that wildness can lead to middle-middle throws that surprise a hitter.
While not a significant predictor for either model, Barrel% did stick around for both after eliminating other predictors. Higher middle-middle rates in pitcher-friendly counts, as well as higher middle-middle-miss rates, were correlated with lower Barrel rates.
Thus, the answer might depend on the pitcher. Our next step as analysts should be to find the threshold of wildness under which it is worth it to nibble at the corners.