Sports Info Solutions
Category: Baseball
-
New baseball podcast: Talking with a top prospect
By
Future Pirates third baseman Ke’Bryan Hayes gives us perspective on the challenges he face, what scouting is like, and much more.
-
How does Mike Tauchman have 14 Defensive Runs Saved?
By
What are the different components that make Tauchman such a good outfielder?
-
What Happened to JaCoby Jones’ Defense?
By
By Lindsay Zeck In 2018, JaCoby Jones led all outfielders in Defensive Runs Saved with 21. He was featured in a blog last October as a multi-position standout with his 11 runs saved in 452 innings in left field and 10 in 558 innings in center field. This season, however, he cost the Tigers 13…
-
Joe Panik: Not a big deal, however …
By
Perhaps there’s more to know about Joe Panik than his basic stats.
-
-
Which Crosstown Team Would Be Best?
By
If we merged the Mets and Yankees, Cubs and White Sox, and Dodgers and Angels, which team would be best?
-
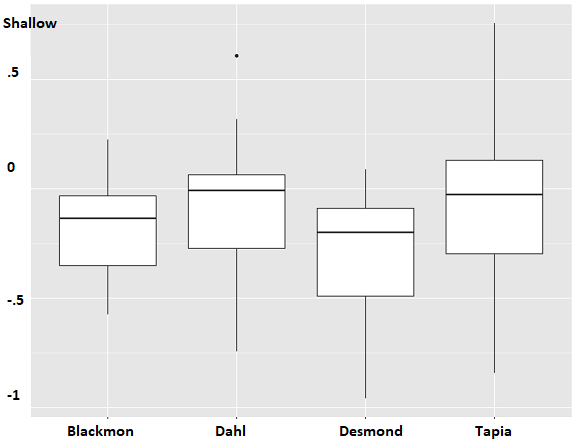
A rocky outfield situation in Colorado
By
Coors Field can have a big impact on those who play the outfield there regularly.
-
More valuable on D: Chapman or Baez?
By
With the two going head-to-head this week, it’s a question worth thinking about.
-
New baseball podcast: Kevin Pillar talks about sliding, diving, and jumping catches
By
LISTEN HERE This week’s episode of the SIS Baseball Podcast highlights defensive excellence in the Bay Area. Senior research analyst Mark Simon (@MarkASimonSays) points out how well Chad Pinder has played recently, with help from Oakland Athletics coach Ryan Christenson (1:04). Then, Mark talks to San Francisco Giants outfielder Kevin Pillar (@KPILLAR4). They discuss the…
-