While we patiently wait for the MLB lockout to end and for baseball to begin, we thought we’d update you on some of the cool work we’re doing in another sport.
In 2020, Sports Info Solutions expanded its sport coverage to include college basketball (you might recall this Stat of the Week). In 2021, we further expanded to fully cover the NBA.
We’re doing the same kind of thing for basketball that we are for baseball – digging deeper to provide insights that help with player evaluation and game strategy. A team of 16 Video Scouts is watching every play of every game, charting things that have never been charted before.
We’re often dealing with the world of opportunities.
When judging whether an NBA player is a good passer, we look to his assist total. But that doesn’t tell the whole story. What about the instances in which that player created an opportunity for an uncontested shot?
That’s the kind of thing that we’re tracking.
If you want to learn more of the specifics, check out this article, which includes explanations and video review.
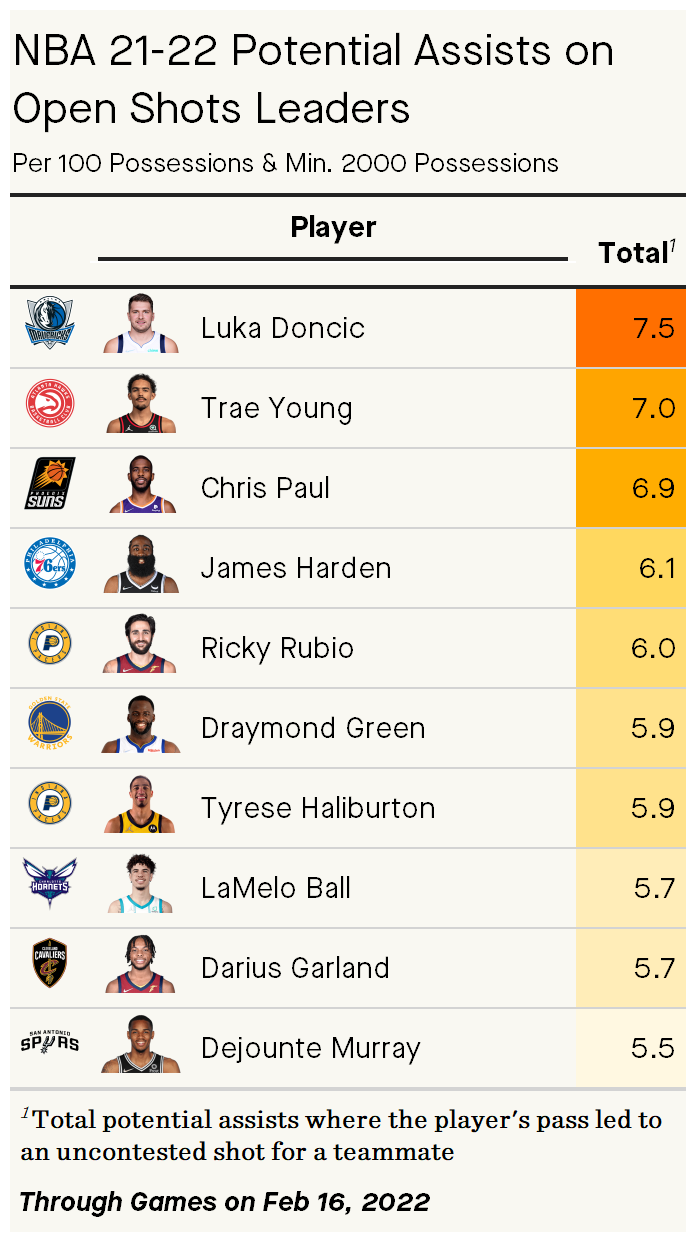
But let’s get to the leaderboard.
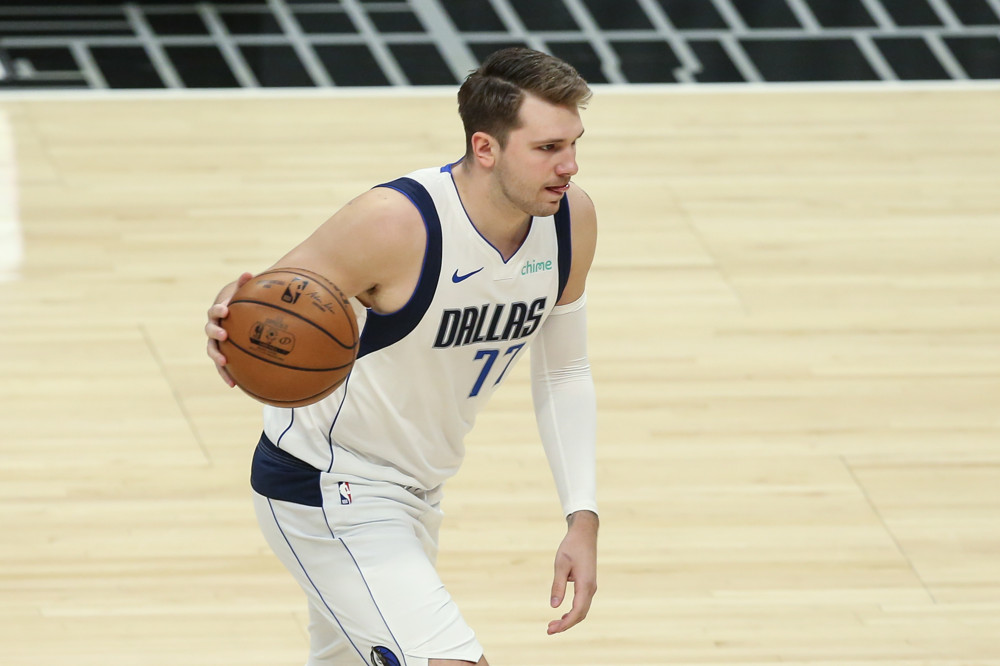
The top three NBA players at creating uncontested looks for their teammates are three of the game’s top stars, Luka Dončić, Trae Young, and Chris Paul.
Here’s the top 10:
A reminder that whether the shooter made or missed the shot is not factored in here. What you can garner from this is that Dončić is the best at creating a lot of high-quality opportunities for his teammates, doing so more than any other player on a per-possession basis.
Just missing the cut on the leaderboard is the NBA’s rookie leader in this stat, 19-year-old Australian-born point guard Josh Giddey of the Thunder (5.4). Though the Thunder are near the bottom of the Western Conference, Giddey’s passing skills have provided prominent value.
Beyond the Top 10, one player for whom this stat is educational is Cory Joseph of the Pistons. The Pistons currently have the worst record in the NBA and though Joseph’s numbers are unimpressive on the surface, he ranks 26th at 4.4 potential assists on open shots per 100 possessions. At age 30, it seems like Joseph still has something left to offer in terms of aiding his teammates’ shot creation.
For more basketball stats and insights, follow the SIS Hoops team on Twitter and be on the lookout for their Playing in Space podcast, which debuts next week.
ALLENTOWN, Pa. – SIS, a leading sports data and analytics provider, has completed an extensive rebranding effort in response to continued growth and expansion into new data markets. The rebrand includes a new website, company logo, color palette, refreshed positioning, more informative product descriptions, and an exciting company video, which can be viewed on the SIS website homepage: www.sportsinfosolutions.com.
For the last 20 years, SIS has been a trusted provider of in-depth, rich sports data to major league teams, sports media, and fans. Powered by proprietary software and a team of analysts combing through game footage for the smallest details, SIS gives teams, sportsbooks, bettors, and fantasy players the edge they need.
Energized by the proliferation of sports data and analytics across pro sports and by continued expansion of sports betting through legislation and regulation in the U.S., SIS will take advantage of the tremendous market opportunity. Its reputation for fast, extremely reliable data is proven with its impressive and loyal customer base.
“This rebrand has been a long time in the making, and we’re thrilled to introduce our new look to our clients and customers,” said CEO Dan Hannigan-Daley. “SIS’ updated logo and narrative better represents the quality of data, our people and our products. We’re expanding into new markets with our deep data sets, including sports betting, and this rebrand positions us as reliable, innovative leaders in the industry.”
SIS’ updated look and use of unique, dynamic sports imagery is sure to provide an engaging experience for partners and sports fans alike. SIS partnered with Team, a Brooklyn-based strategic design studio, to creatively execute the update.
About SIS:
Our mission is to enrich and optimize the decision-making process for sports teams, sportsbooks, and sports fans. Learn more at www.sportsinfosolutions.com.
When my mother was growing up, she trained professionally to join a ballet company. She would spend hours upon hours practicing the tiniest details to make sure every aspect of her performance was perfect — nothing was viewed in isolation.
A tour jeté, though one movement, is composed of multiple building blocks. You start in the correct position, slide backward, kick your leg up high, turn yourself around in the air, and then land on one leg with the other extended in the back.
She would repeat this movement across the studio, breaking down the whole into its component parts. Her teacher would point out areas for improvement in each specific component of the step. For example, the leg could be higher; the turn could be sharper; the arm could be positioned better; or the landing could be softer.
Even if well executed, there was always room for improvement.
My mom instilled in me that evaluation of the whole is really an analysis of the component parts — to do otherwise betrays the beauty and depth of the whole.
In all aspects of basketball analysis, I keep this wisdom in mind, but it is no more relevant than when examining passing. If the angle of delivery is slightly off, the player receiving the ball might not be able to get a shot off; if the pass is soft rather than zipped through the defense, it might get deflected or picked off; if the wrong pass is used (lob instead of pocket), the ball may never reach the target.
By saying “____ is a great passer” rather than breaking passing down into its sub-skills, we are doing a disservice to the art of passing (and inaccurately assessing the player’s true ability).
“By saying ____ is a great passer … we are doing a disservice to the art of passing …”
Rather than saying someone is a “good” passer, we must focus on the components that make the passer good — maybe it is the craft, the accuracy, or the variety of passes made. But, if you want to honestly quantify passing with existing metrics, you are at a loss.
Assists neglect perfectly executed passes resulting in missed shots; assists treat both complex and straightforward passes producing makes as equivalent. Meanwhile, turnovers are much more a symptom of usage than a passing metric.
A picked handle or fumbled dribble, though having to do with ball-control, has nothing to do with passing ability. Neither assists nor turnovers, though the closest things to passing metrics the box score offers, provide much insight into passing.
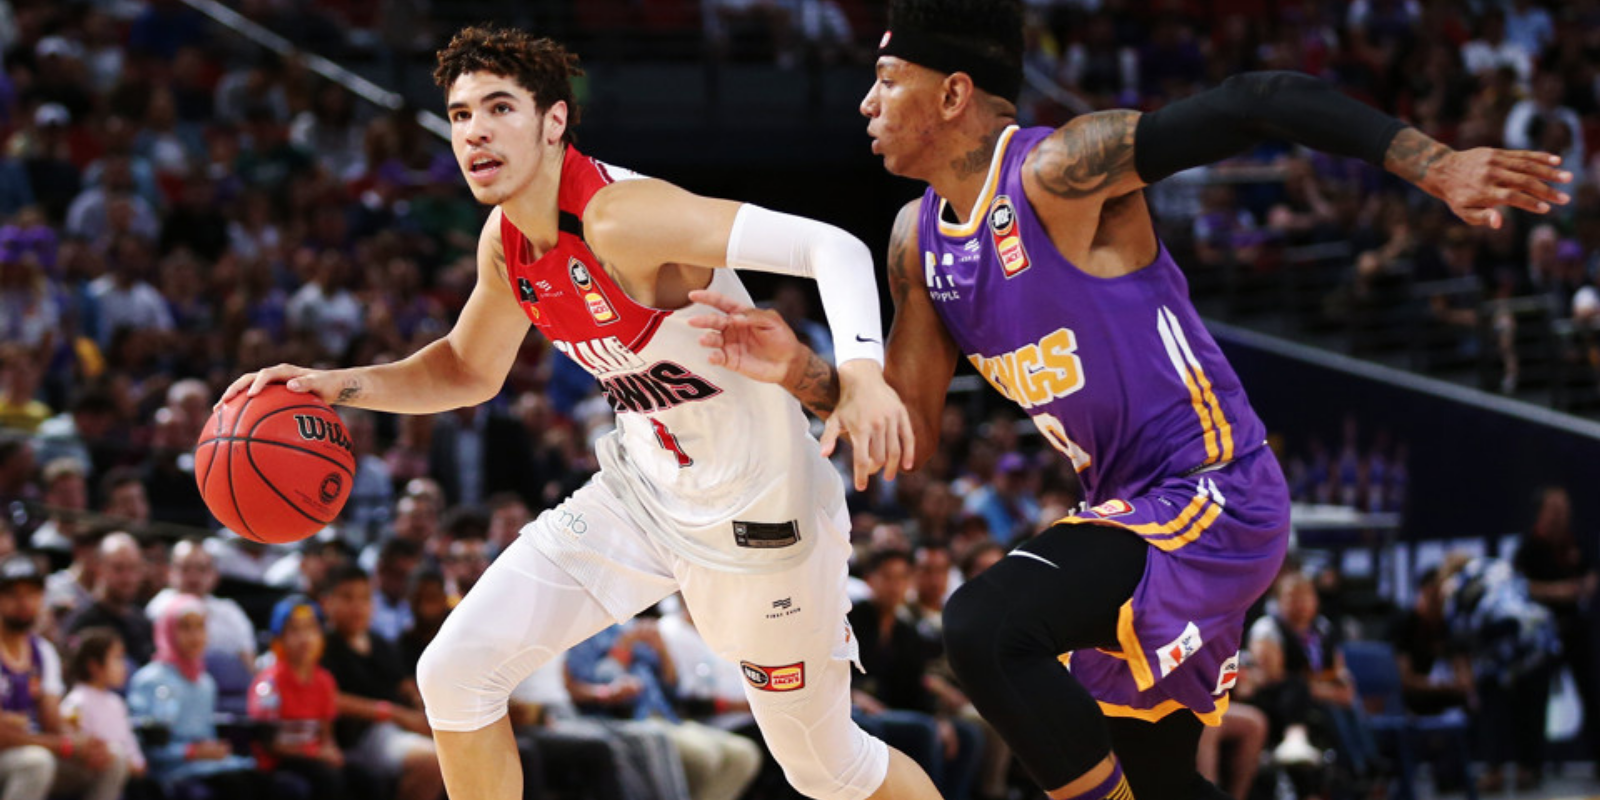
The 2020 Draft presents instructive examples of how the passing whole is distinct from its parts. LaMelo Ball and Tyrese Haliburton were two of the best passers in the draft and Isaac Okoro and Patrick Williams were two of the best among wings. However, the wings had little in common with the ball-handlers in terms of raw box score output.
2020 Wing AST/TO Ratio
Player
AST/TO
Devin Vassell
2.13
Desmond Bane
1.68
Saddiq Bey
1.61
Josh Green
1.59
Aleksej Pokusevski
1.56
Elijah Hughes
1.49
Skylar Mays
1.43
Leandro Bolmaro
1.36
Deni Avdija
1.25
Jahmi’us Ramsey
1.11
Isaac Okoro
1.04
Isaiah Joe
1.00
Robert Woodard
.69
Jaden McDaniels
.65
Patrick Williams
.58
Cassius Stanley
.56
Aaron Nesmith
.54
Using traditional metrics to draw conclusions on passing ability misses the mark because there is no way to divide passing into its parts. However, by breaking passing down into its sub-skills, we can show that a “good” passer might have holes in his passing repertoire that need to be improved, and a “bad” passer might have legitimate passing acumen. By approaching passing through a more nuanced lens, we better understand each skill in actionable ways.
Micro-skills of “Good” and “Bad” Bad Box Score Passers
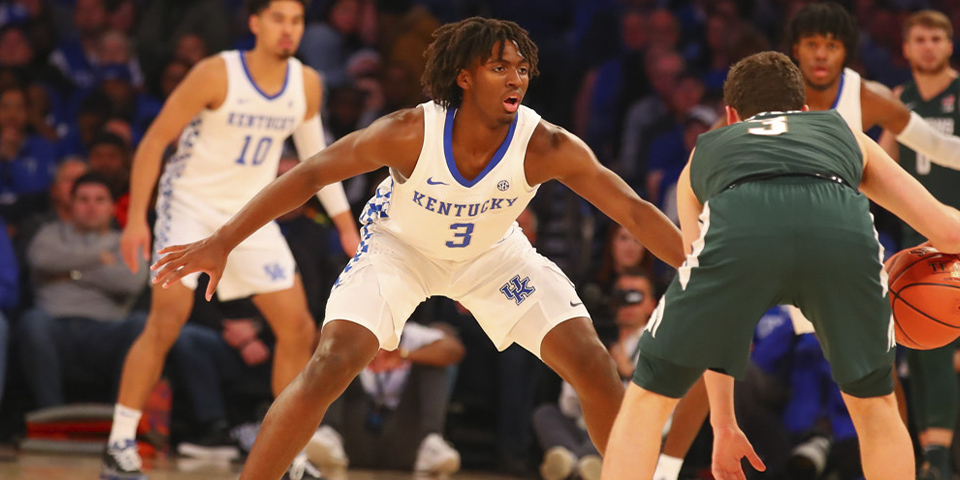
While at Auburn, Isaac Okoro showed legitimate skill as a second-side creator due to his ability to make intelligent passing reads against a moving defense. However, his passing aptitude did not show in the box, as he was barely above a 1:1 AST/TO ratio.
SIS Passing Metrics Ranks
Metric
Isaac Okoro
Patrick Williams
Complex %
2nd
15th
Pass to Result
1st
16th
Moving Dribble %
7th
4th
Simple Inaccurate %
14th
16th
Complex Inaccurate %
5th
14th
+ Pass Craft
7th
1st
Okoro had real passing acumen in a few areas. He often made complex passes (2nd among wings), quick decisions (3rd among wings), and put zip on the ball to ensure it reached the intended target on time.
However, Okoro also had a genuine shortcoming as a passer: accuracy. Though he ranked 5th in our accuracy metric as a complex passer among wings, he was 14th out of 17 in simple pass accuracy, 10th in defensive manipulation, and 13th in touch passes. He completed complex passes and possessed some passing craft, but he would also whiff on simple ones and lacked craft in other areas.
A casualty obscured by role, Patrick Williams played almost exclusively off-ball at Florida State and had fewer passing opportunities than Okoro (13th among wings for Williams vs. 6th for Okoro). In the limited chances he was tasked with creating for others — despite a very poor AST/TO ratio — Williams showed valuable passing skills, including those that did not show up in the box score.
Williams was 4thamong wings in our Pass Expected PPP[1], 4th in both Complex Success % and % of Passes Off Dribble, and ranked 1st in our +Pass Craft and Zip metrics.
Williams flashed advanced passing ability but also had legitimate flaws, most notably in Volume of Complex Passes[2] (15th) and overall accuracy (12th, including 16th in Simple and 14th in Complex). From our data, we can conclude that Williams’ main shortcomings were accuracy and pure volume[3].
Williams also had the 2nd lowest Pass to Result rating among wings in our database. This means that his passes often did not play a role in the result of the possession. Despite Williams’s passing craft, he struggled in the only dimension that assists capture: results, the element of passing the passer controls the least. Williams threw valuable passes, but his teammates failed to realize that value in results.
Even passers who put up gaudy box score numbers are not perfect.
LaMelo Ball’s room for improvements were his accuracy with simple passes (18th of 18 ball-handlers), quick passes (18th of 18), and ability to fit the ball in tight spots (11th of 18).
Tyrese Haliburton’s passing skill gaps were in zip (12th of 18 ball-handlers), accuracy on simple passes (15th of 18), and passes off dribble penetration[4] (15th of 18). Haliburton and Ball routinely threw elite passes and had the box score numbers to support the narrative that they were top-level passers. However, as good as they were, they still had areas for improvement.
Accurately Evaluating Passing
Nothing in basketball is black and white.
You would not describe a good pick-and-roll defender who misses rotations and is prone to losing his man off the ball as a great defender.
You would not regard an elite pick-and-roll defender in a drop scheme who is not a good defender in a soft-hedge or switch-heavy scheme as a terrible pick-and-roll defender.
You would not label a great catch-and-shoot shooter who cannot fire off movement or off the bounce a great shooter overall, but great in a single subset of the entire skill.
Passing is no different.
By recognizing the nuance of the sub-skills within passing, evaluators can provide more accurate representations of the entire skill. In doing so, we can project and develop players precisely. The great catch-and-shoot shooter who cannot shoot off movement is not drafted to sprint off screens or told to work on “shooting,” but is selected to hoist spot-ups and told to work on movement shooting.
Projecting and developing passing must go beyond the rigid world of “good” and “bad.” Players must be considered in contexts and roles as passers. Perhaps a ball-handler is elite at hooking passes to popping big men but cannot execute accurate lobs; the pick-and-roll partner he will be paired with will prove crucial to his projection.
Likewise, a player development coach would be remiss to work on pick-and-roll passing with that ball-handler, instead needing to focus on particular deliveries. Through all phases of player evaluation, projection, and development, we owe it to players to be precise. Only then can we put them in the best positions to succeed.
While speaking with my mom to get the proper ballet terms needed for this piece[5], she said movement in ballet is never perfect and the ballet dancer is always on that quest for perfection, constantly breaking down each piece of the movement to improve the whole. It’s time for passing evaluation to match that same energy[6].
[1] This indicates that he set his team up with good shots that may not have been capitalized upon by his teammates
[2] Williams showed the ability to complete complex passes, but the volume was not high
[3] Volume can at least be partially attributed to his role at Florida State
[4] Passes from the paint that came off dribble penetration
[5] I know absolutely nothing about ballet except for what a tour jeté is (thanks mom for laying it out in layman’s terms!)
[6] If it doesn’t, I won’t hear the end of it from my mom
it’s time to look beyond the defensive metrics we were given.
By MAX CARLIN AND CONNOR AYUBI
Public NBA draft analysis is a game of proxies. With some 3,000 games played by 100 or so NBA-relevant prospects each year, no individual could possibly consume — let alone accurately evaluate — the complete sample of players that make up an NBA draft class. So, scouts turn to stand-ins, whether they be subsets of the games each prospect plays, statistical indicators, or ideally some combination of the two.
In some areas, this approach is relatively sound. Armed with tools like play type information, shot locations, and assist data, one can begin to check and legitimize observations from film analysis. You could, for example, verify that a prospect who appears to self-create a high frequency of rim attempts on film does so with the above information.
Yet defense remains something of an unquantifiable anomaly. Most commonly, those looking to corroborate their eyes on the defensive end turn to steal, block, and the composite stock (steal + block) percentage. The idea behind using these measures as surrogates rests upon the notion that they correlate to notable defensive impact (or at least to basketball IQ or physical tools).
The issues block, steal, and stock percentage present as proxies are two-fold: what they do capture and what they don’t capture.
An instructive block
Consider this sequence from Precious Achiuwa, whose lunge at the ball-handler for no discernible reason generates a layup attempt. Likewise, his ability to plant hard, explode in the opposite direction, rise quickly off one, and extend for the block erases it:
This block represents a false positive in the department of winning impact. Purely by the measure of blocks, this play is indistinguishable from a textbook rotation punctuated by a swat. Instead, a faithful retelling of this scenario would capture that Achiuwa has the physical tools and wherewithal to recover but created his team’s disadvantage in the first place. There are laudable and noteworthy projectional elements to the sequence but it is not a positively impactful one–pieces of information that we at Sports Info Solutions insist on keeping distinct and evaluating separately.
Instead of approximating what we don’t see, we’re empowered to watch everything and log every defensive contribution a prospect makes (or fails to make) for an entire season.
Meanwhile, the limitations of what blocks and steals don’t capture far outweigh what they do. Typically, blocks and steals provide results-based information on the conclusions of 2-3% of a prospect’s defensive possessions, while entirely missing the rest of the approximately 80% of possessions in which a prospect engages in at least one meaningful defensive action, according to our research.
At SIS, we’re lucky to have a staff of basketball experts capable of consuming and evaluating the hundreds of thousands of possessions prospects put on film each draft season.
Among others, we have at our disposal an overall defensive impact statistic called Defensive Winning Impact (DWIMP). Instead of approximating what we don’t see, we’re empowered to watch everything and log every defensive contribution a prospect makes (or fails to make) for an entire season. With such a powerful metric at our disposal, we are enabled to investigate questions like the validity of stock percentage as a defensive proxy.
Our findings? Neither stock percentage nor its component parts are particularly useful stand-ins for defensive impact:
For this analysis, we focused on quality-controlled data from the 2020 NBA Draft. The unimpressive visual relationship between stock percentage and DWIMP translates to a statistically insignificant correlation.
Furthermore, a player’s stock percentage provides no indication of their ratings in our Basketball IQ or Physical Tools metrics:
An illustrative pair
Since DWIMP is both more comprehensive in its scope and nuanced in its evaluation than stock percentage, we see some players with highly discordant DWIMPs and stock percentages:
DWIMP diverges most from stock percentage for a pair of instructive ball-handlers. Both Malachi Flynn and Tyrese Maxey underwhelmed by conventional defensive playmaking stats last year, but the more comprehensive defensive analysis underlying DWIMP captures the steady impact both guards provided through reliability.
Flynn and Maxey ranked first and second respectively in off-ball defensive consistency among the 18 ball-handlers in our sample last year. While neither player made a ton of plays on the ball, both satisfied their responsibilities as team defenders. It was rarely electric, but it was clinical, and the two significantly improved their teams’ defenses accordingly:
A tag here, a stunt there, throw in a nice dig to force a ball pickup–the box score tells you Maxey does nothing on this possession, but his true impact is undeniable.
On the ball, the pair maintained their steadiness. Flynn sat first and Maxey third among ball-handlers in our point-of-attack defense metric, driven by unsexy factors like ranking first and second respectively in screen avoidance:
On top of technical excellence, traditional stats fail to even capture the full gamut of defensive playmaking. They miss the effort, activity, and spatial awareness underlying the non-steal deflections that were routine to Flynn, who ranked second among ball-handlers in our On-Ball Disruptions metric, which accounts for things like pressures and deflections in addition to steals and blocks.
Just as the two did what was demanded of them to add value, they avoided crippling mistakes that concede value. Flynn placed first in our entire 50-player sample in both defensive discipline and defensive IQ, while Maxey ranked second among ball-handlers in those metrics. Avoiding low-effort plays and limiting bad gambles, Flynn and Maxey added defensive value not through occasional excitement but mundane excellence.
Though Flynn and Maxey succeeded through — broadly speaking — one defensive style, none of this is to say the only way to provide defensive value is by eschewing defensive playmaking in favor of reliability. High lottery picks like Patrick Williams and Onyeka Okongwu, for example, posted both gaudy DWIMPs and stock percentages; high block, steal, or stock percentage does not mean bad defense.
they do as they say
Instead, our research indicates block, steal, and stock percentage don’t mean much of anything. They’re not indicative of positive or negative defensive impact, outlier or ordinary physical tools, basketball ingenuity or incompetence.
Block, steal, and stock percentage are not bashful. They are exactly what they say they are: the rates at which players accumulate blocks and steals. They are limited by the constraints of what blocks and steals themselves are–an inaccurate pass that simply falls into a player’s hands is a steal.
To infer more from block, steal, and stock percentage does a disservice to those metrics. As such, basketball discourse is better served by using stock percentage and its components for their designed purposes rather than as proxies for true defensive impact.
An introduction to SIS Hoops and our objective to modernize the box score.
By JAKE LOOS
There’s a wrong way to ball.
My 7th grade coaching staff shared box scores with the team the morning after games with players ordered by Overall : a linear combination of box score elements into an all-in-one stat[[[Possibly the beginning of my disdain for all-in-one basketball metrics]]]. Usually a shoot-first, defense-optional player, I became obsessed with this ridiculous stat. I started passing up open jumpers (missed shots counted as -1) to chase assists (+2). On defense, I’d often be out of position gambling for steals (+3) and recklessly crashing the glass for defensive rebounds (+2) despite my -2 wingspan and 10-inch vertical leap.
After starting the season ranking in the middle of the pack each game, I regularly led our team in “Overall” by the Playoffs. I felt like I had really improved as a player, and our team won most of its games[[[Milwaukee’s northern suburbs are a bit deprived of high-level competition]]]. I knew I was never going to be a professional player, but I still thought there was a chance I was going to end up riding the bench for a Big Ten school.
Before high school even ended, my organized basketball career was over.
Over 15 years later[[[A lot to unpack here… maybe another time]]], I was lucky enough to spend 5 seasons with the Phoenix Suns obsessing over how to best quantify basketball players and teams, and apply it in roster construction and in-game strategy. Despite the blessings of working in a dream job, I let how the game is discussed and presented – on broadcasts, podcasts, Twitter, video games, or even in internal meetings – drive me insane. The main reason why is so familiar: the same overreliance on the box score as my childhood basketball career.
And that makes sense! If your job is to succinctly summarize a player’s impact on winning a particular game, you’re going to use what’s available to you. It’s easy for the audience to understand, and often highlights the players with the most direct involvement in scoring. But that doesn’t mean it’s the right way.
Can there be a better box score?
Basketball is too complex a sport to be defined by its possession-ending events. It’s a game that requires instantaneous, random decision-making on every offensive and defensive possession while executing within defined roles to optimize team performance. That’s a wordy way of saying “playing basketball is super hard.” Playing it at a high level requires an intimidating mix of skill, intelligence, athleticism, and winning desire.
Unfortunately, the statistics available to us merely summarize possession-changing events and forsake the beauty of the how and why of each possession. The traditional box score measures only a subset of on-ball offensive plays – those leading to a shot, foul, or turnover – and omits all other on-ball plays, the actions of the players away from the ball, and almost the entirety of defense. While it’s fun to discuss shot charts and triple-doubles, we’re missing some massive pieces to the puzzle on why a particular team won the game, and which of those team’s players contributed the most to that win.
Thankfully, we have come a long way as a basketball community. So many talented people have furthered the public discourse through their written pieces, video, and podcasts. There are now better places to get in-depth, well-presented statistics[[[The NBA has done an excellent job improving its Stats site and Cleaning the Glass is serious front-end goals]]]. But those sites still rely on box scores, play-by-plays, and, at best, basic Tracking stats[[[These stats are a step forward, but are mostly a regurgitation of result-driven info]]]. There is still so much information missing.
With only +/- stats available to the public and Player Tracking data’s significant limitations measuring decision-making and defense, it’s difficult for even the most informed evaluators to summarize which players are actually impacting winning on the court. Studying all 10 players at once for 40-48 minutes of action is both challenging and exhausting for one game, let alone many.
So, can we create better basketball data?
At SIS Hoops, we’ve spent the last year striving to fill those gaps. Though at the moment we cannot release our data to the public due to our team business, we plan on sharing some of our internal research to hopefully further the discourse on how basketball is understood.
Our initial project concentrated on the last 2 NBA Draft classes, achieving enough success to expand our coverage to include the NBA in the coming months[[[And hopefully other levels of basketball in the near future]]]. We feel that access to granular player- and team-level winning-impact data will help us better understand what actually matters the most on the court, who is the best at those things, and how those skills develop.
Our evaluation framework is grounded on accumulating every on-court event that could alter a team’s chances of scoring or preventing a score.
This can be as simple as a late-shot clock pick & roll where the ball-handler takes two dribbles and passes to a teammate on the wing. It can also be as complex as assigning blame to on- and off-ball defenders on an eventual shot at the rim. Over the course of a game, all of those plays matter. Collecting data of that scope requires a consensus on what a “good” and “bad” basketball play entails, an assessment of the difficulty of the context surrounding the play, and knowledge of the offensive and defensive schemes at play. But with proper training, you’d be surprised at how consistent basketball experts are at identifying winning and losing basketball plays.
Access to data of this breadth is really exciting. We can better understand how a player scored rather than just the fact they scored. We can properly assign credit to players for creating great looks for teammates despite the shot being missed. We can even evaluate how a player impacted a defensive possession, and whether their impact occurred at the point-of-attack or away from the ball.
We can now identify players who help their team win, even if they lack production in the box score.
High-level role players are the key to any good basketball team.
Maybe rooting for players who do the “little things” is an overcorrection to how I played and the way I first valued players, but I stan the hardest for players who do exactly what they’re supposed to do at a high level consistently[[[Mikal Bridges will forever be in my heart]]]. And given how many decisions each player has to make in a game[[[For a typical Draft prospect, this ranges from 100-200+]]], playing consistent ball is not an easy task. With the attention naturally on players who score the most, dish out the most assists, or grab the most rebounds, not enough credit is attributed to the role players who allow the stars to focus on what makes them stars.
With my concentration on Draft prospects over the last year, I admittedly missed most of the NBA season. So, it came to my surprise when watching the (incredible) Warriors-Lakers play-in game to observe how good some of Dubs’ role players had become[[[Yes, I realize I’m writing about the “winning role players” for the Warriors in a game they lost]]].
Playing next to gifted playmakers like Stephen Curry and Draymond Green requires instinctual engagement away from the ball on offense. Sometimes an excellent off-ball read can help create a great look, and other times it doesn’t affect the result of the possession at all. But players should get credit for the potential chances they created in some way.
The best role players are reliable, willing, and disruptive defending away from the ball. Given the importance of team defense in a team’s overall success, we need to find better ways to value that off-ball defensive consistency, willingness, and impact.
Considering the importance of getting early looks on offense[[[Transition / Early Offense opportunities usually give NBA teams a 0.2-0.3 PPP boost in their scoring efficiency]]], players with a steady and possession-altering motor in both offensive and defensive transition are crucial to a team’s success. Our favorite role players thrive here as well.
It’s still (mostly) about getting buckets.
We can flaunt quantifying discipline, IQ, and motor all we want, but in the end, buckets win ballgames – the elite advantage creators and shot-makers are still the most important players. The real fun part of the job is studying those unicorns.
Our framework devotes the most detail to the most important part of the game. Not all buckets are created equal, requiring faithful analysis to explore the countless contextual details. Did the player start their on-ball chance in an advantageous situation? Were they pressured by the opponent? Were they able to create an advantage? If so, how did they create that advantage? What kind of shot, if any, was created? Did they make the optimal decision? We will learn so much more about a player’s on-ball talent from answering these questions instead of relying on the number of points their chances resulted in, as long as it resulted within 2 passes. As any good evaluator knows, the process is more important than the results.
Sometimes the process and the results can be fun. Here are some ludicrous Steph buckets from that game showcasing his ability to create all sorts of advantages.
We want to better understand hoop.
Our content in the upcoming month will center on the NBA draft: the next main event after the Finals, the subject of our data, and our analysts’ specialty. It is also where public and front office discussions have the most room for growth. Having myself championed prospects in the Draft Room due to their box score production or perceived upside, I’ve had to learn the hard way how challenging it is to project teenagers as professional basketball players. My projections improved drastically once I started focusing on their actual basketball-playing ability. And our content will do the same.
We’ll explore in-depth the traits that build the best basketball players, why they’re important, and how you can better evaluate them from your couch. Please engage with us and let us know your ideas – our experienced staff of scouts and researchers will be tackling these topics, and I promise their work will be much more interesting than this piece.
Our data is a completely new way to quantify basketball and we have no idea where it will take us, especially as we analyze an ever-evolving game. But we will learn as we go, just as I did when I turned that failed childhood basketball career into my life’s work.
On this special edition episode, Mark Simon (@MarkASimonSays) is joined by Sports Info Solutions Director of Basketball, Jake Loos (@Jake_Loos). SIS recently announced that it would be entering the basketball business. Jake, the former director of basketball analytics and technology for the Phoenix Suns will head up our operation. Jake talks about his background, which includes an MBA from MIT and what he loves about basketball and statistics (1:12). He then details the challenges of basketball analytics and trying to explain it to non-analytically inclined fans (7:26).
He also explains what SIS will be doing with basketball data and the challenges of trying to do the kind of player evaluation he wants to do (11:18). He also talks about why Joe Ingles of the Jazz is one of his favorite players (20:24), why Stephen Curry and Dwyane Wade’s stats are his favorite (22:24), and gives advice both on how to watch the game smarter (25:48) and how to pursue a career in basketball analytics (26:48).
Back to our usual programming later this week. Thanks for tuning in!
On this edition of the Sports Info Solutions Baseball Podcast, Mark Simon (@MarkASimonSays) is joined by Washington Wizards assistant coach Dean Oliver (@DeanO_Lytics), a pioneer in basketball analytics, to discuss some of the challenges of measuring defense in his sport.
Dean talks about the differences in basketball analysis contrasting 25 years ago to now (2:18), the parallels between tracking defense in basketball and baseball (5:23), and trying to chart the effectiveness of double-teams, getting hands in the face of shooters, and deflections (8:07). He also explains the influence that coaches have on defensive performance (14:07).
Lastly, he discusses the different perspectives on fouling when up by 3 points in the final seconds (18:32) and offers advice to aspiring statistical analysts (22:32).
With the baseball postseason over, it’s time to immerse ourselves in the NFL and NBA. If you haven’t paid close attention to this point, or are just curious for some interesting analysis, the Bill James Online Power Ratings are here to help.
NFL
Bill James Online Power Ratings
Team
1.
Saints
111.7
2.
Chiefs
110.9
3.
Rams
110.2
4.
Steelers
109.5
5.
Ravens
108.5
The top NFL team by the power ratings is the New Orleans Saints, who edge out the Kansas City Chiefs and the Los Angeles Rams. The Pittsburgh Steelers and Baltimore Ravens round out the Top 5 overall. The Power Ratings are intended to show how many points above (or below) average that a team is to that point in the season. The NFL Power Ratings use 100 as a baseline, so the Saints would be 11.7 points better than the average team.
The 8-1 Saints have eight straight wins, including two wins over Top-5 teams. They’ve beaten the Ravens on the road and the Rams at home. They’ll face the struggling defending Super Bowl champion Eagles on Sunday. Drew Brees is playing like an MVP with 21 touchdown passes and only one interception.
The Chiefs have looked ultra-impressive thanks largely to quarterback Patrick Mahomes, whose first season as a starter has been a record-setting one. His 31 touchdown passes are a Chiefs single-season record.
Rams running back Todd Gurley may have something to say about Brees’ and Mahomes’ MVP candidacies. He leads the NFL with 988 rushing yards, 13 rushing touchdowns and 17 touchdowns overall. Gurley has a chance to be the first player to lead the NFL in touchdowns scored in consecutive seasons since Shaun Alexander for the Seahawks in 2004 and 2005.
NBA
Bill James Online Power Ratings
Team
1.
Bucks
214.9
2.
Trail Blazers
209.8
3.
Warriors
207.8
4.
Clippers
206.9
5.
Raptors
206.8
(Note that the NBA uses 200 as a baseline. The Bucks are 14.9 points better than the average team).
The early surprise in the NBA’s Power Ratings (which are based entirely on this season’s performance) is that there are two teams ahead of the Golden State Warriors — the Milwaukee Bucks are No. 1 and the Portland Trail Blazers are No. 2.
Both the Bucks and Trail Blazers are 10-3. The Bucks have shown their mettle by beating the Raptors (No. 5 in our rankings) by 15 and the Warriors by 23, though they’ve lost to both the Clippers (No. 4 in our rankings) and the Trail Blazers. The addition of Brook Lopez has boosted a Bucks team that leads the NBA in three-pointers made and is averaging 121.6 points per game. Giannis Antetokounmpo is averaging 25 points and 13 rebounds to lead the way for them.
Damian Lillard, C.J. McCollum and the Trail Blazers are trying to bounce back from a disappointing finish to last season when they got swept by the Pelicans in the first round of the playoffs. They’ve won three straight games against prominent teams — the Bucks, Clippers and Celtics– to wrap up a six-game homestand.
Up next is six straight on the road, including back-to-back games to close the trip against the Bucks and Warriors. Their next home game is against the Clippers on Nov. 25.
The power ratings will be worth checking again at that point to see whether the Trail Blazers have the staying power to remain among the league’s top teams.
If you want to keep up with the Power Ratings, you can follow them with a subscription to Bill James Online.