Sports Info Solutions
Category: MLB
-
Stat of the Week: Who is May’s top defensive player?
By
Was our choice Cody Bellinger or Matt Chapman?
-
How are the Twins getting it done?
By
The Twins are racking up wins. What have been the keys to their success?
-
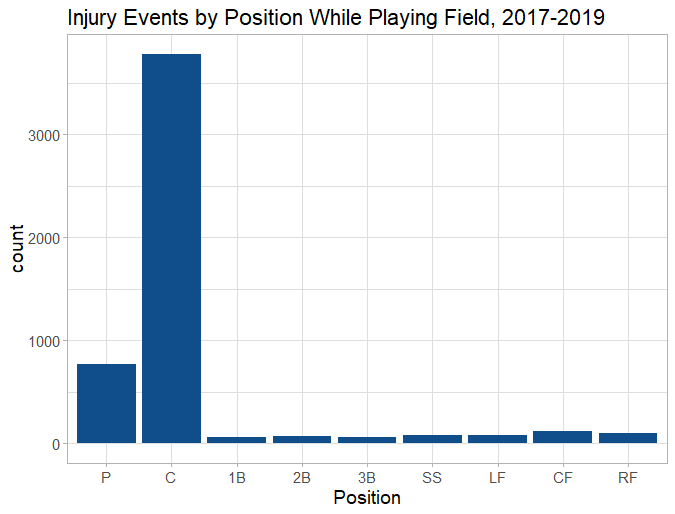
On Catcher Injury Risk and Managerial Decision-Making
By
Managers often avoid using backup catchers out of fear of injury. But how often do catchers actually get hurt?
-
The Dodgers’ dominant defense
By
By Mark Simon The Dodgers are poised to not just dominate the NL West again, but to dominate all of baseball in defensive performance. The Dodgers lead MLB with 62 Defensive Runs Saved. The next-closest team entering Thursday is the Astros with 45. What’s impressive about the Dodgers is that they’ve done this after they…
-
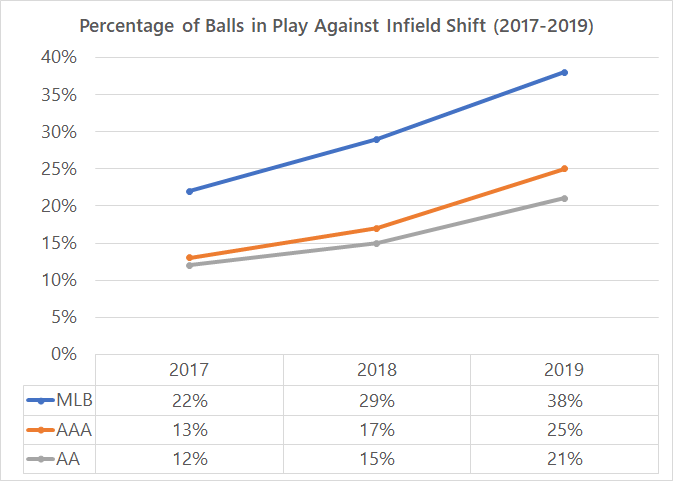
The Rise of Minor League Defensive Shifts
By
We talk a lot about shifts at the MLB level. What about in the minors? Are they rising like they are in the majors? Are they are as common?
-
What’s been behind Justin Verlander’s great season?
By
Slider dominance and defensive dominance are going hand in hand to allow Verlander to outperform his peripherals.
-
Who can we combine into the best 5-tool player?
By
You’d need someone who could hit, hit for power, run, field and throw. Basically we’re asking: How do you build a Mike Tout?
-
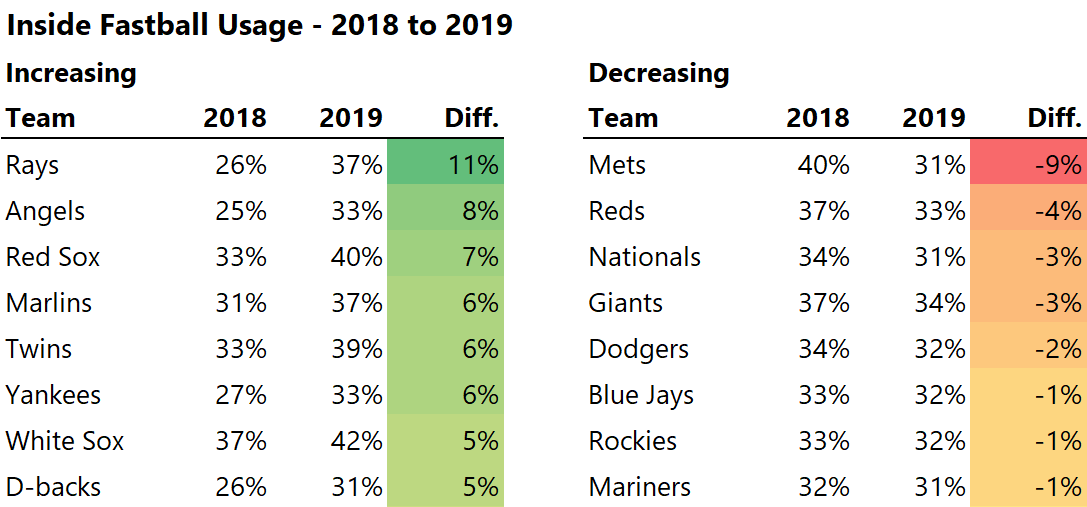
Mets moving away from the inside fastball
By
The Mets threw the highest percentage of inside fastballs in 2018. That hasn’t been the case in 2019.
-
Do fielders dive more when a potential no-hitter is on the line?
By
Jurickson Profar and Gregor Blanco made us wonder about this.
-
Home Run robberies are up … at least recently
By
5 HR robberies in the last 3 days prompted us to take a look at the season record, the current pace, and more.