Sports Info Solutions
Category: MLB
-
What has happened when 4-man outfields were used this season?
By
There has been about as much usage of the 4-man outfield in the first month of 2019 as there was in all of 2018. We take a closer look.
-
Which players do the most good & bad things on the bases?
By
We track Good Baserunning Plays and Bad Baserunning Plays. We’ll explain the system and show why Javier Baez fares best.
-
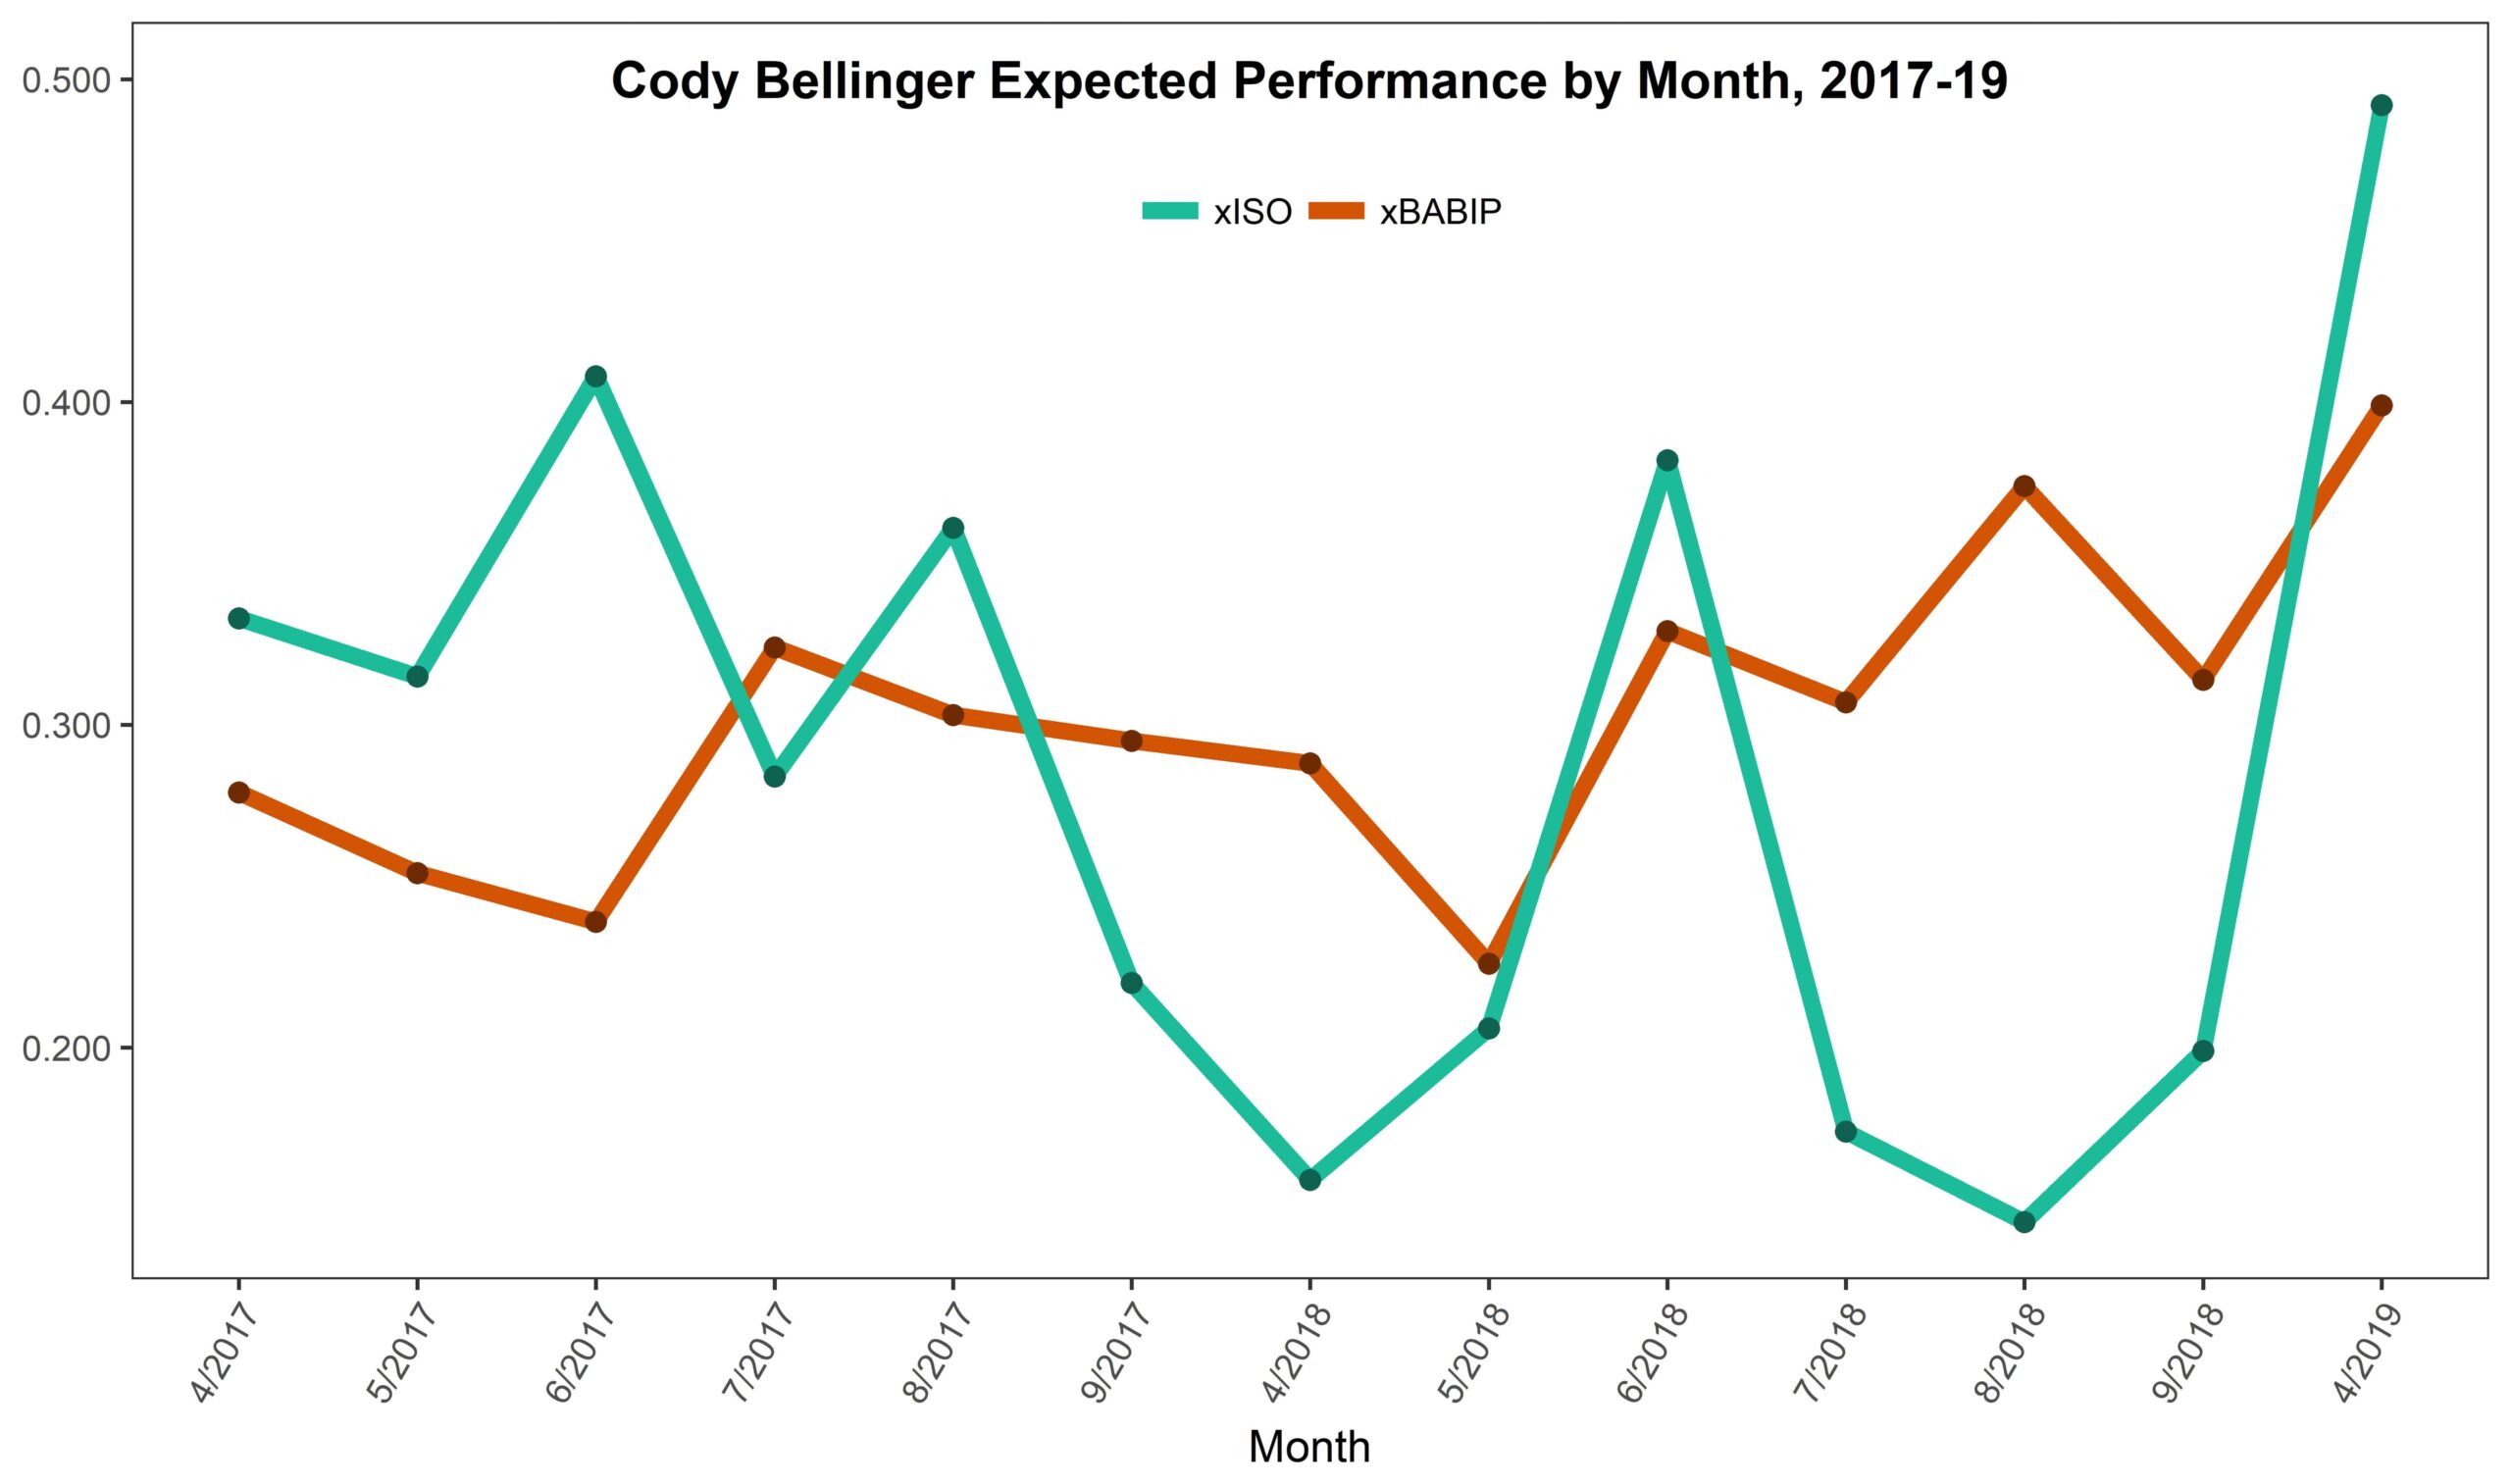
Cody Bellinger is Having a Plate Discipline Renaissance
By
Cody Bellinger’s numbers are amazing, and that goes beyond his Triple Crown stats.
-
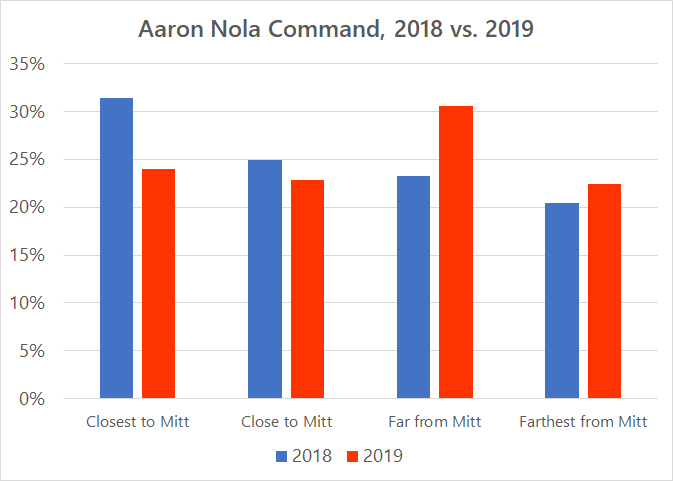
Quantifying Aaron Nola’s Early Season Command
By
A look at what our command charting metrics say about Aaron Nola’s slow start.
-
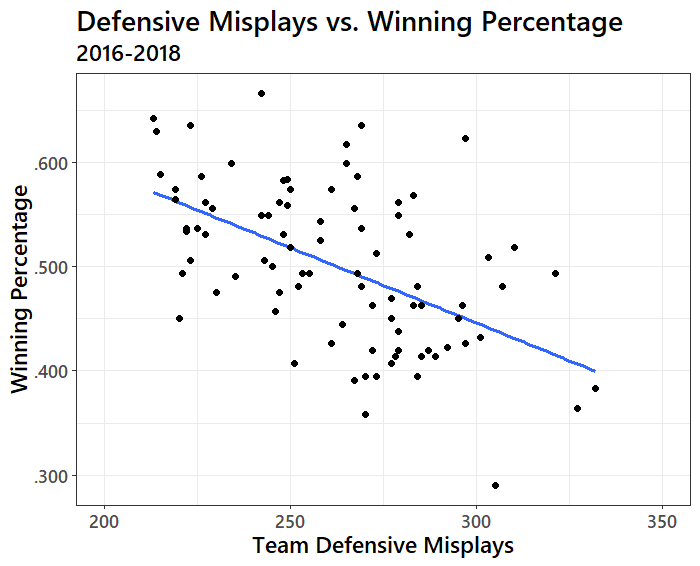
The Cost of Defensive Mistakes
By
The Mariners started the season at a torrid pace, but were one of the worst defensive teams in baseball. How do our Defensive Misplays correlate with winning?
-
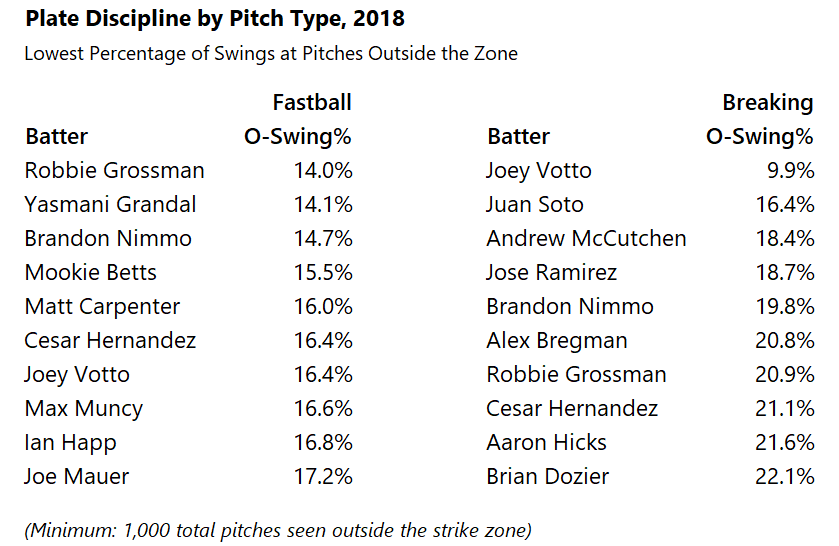
Breaking Down Plate Discipline by Pitch Type
By
Is Joey Votto’s greatness evident against both fastballs and breaking balls? Who else is that good?
-
The Orioles are fully embracing shifting
By
The Orioles have embraced it at a very high level … so far.
-
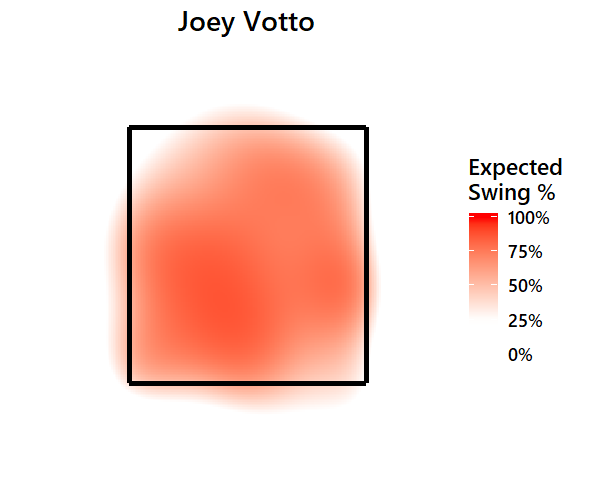
Visualizing Plate Discipline
By
We can put a number on plate discipline. But what does it look like? Where are hitters taking their swings, and how far do they extend their zones?
-
What is Strike Zone Runs Saved?
By
This is our method of telling you who is good at pitch framing and who isn’t.
-
March’s Most Interesting Team Was… the Marlins?
By
Why? Because of their significantly unusual shift usage vs the Rockies this past weekend.