The combine is a distant memory, pro days are all but over, and it seems all that’s left to do is twiddle our thumbs as teams make their final preparations for the NFL Draft. But, arguing among ourselves about quarterbacks is a rich tradition, so perhaps that is the best way to occupy our time as we countdown to April 26.
From an analytical perspective, the search for QB1 begins and ends with Kyler Murray, who dominated the advanced stats leaderboards in our inaugural Football Rookie Handbook. Murray is widely expected to go first overall to the Arizona Cardinals, but prognosticators are less certain about how the rest of the chips will fall.
Three other quarterbacks – Ohio State’s Dwayne Haskins,
Missouri’s Drew Lock, and Duke’s Daniel Jones – are also receiving first round
consideration, and there’s no shortage of potential landing spots. The Giants,
Broncos, Bengals, Dolphins, and Redskins are franchises with long-term
uncertainty at the position who pick within the top half of the first round.
From an Expected Points Added (EPA)/attempt perspective,
Haskins (0.3) is head and shoulders above Lock (0.13) and Jones (-0.04). He’s
also considerably more accurate, having delivered an on-target ball on 76% of
his throws in 2018, whereas roughly 30% of passes thrown by Lock and Jones were
uncatchable or required an adjustment.
Haskins’ detractors will point to his low average depth of
target (ADOT) of 7.9 yards and cite that he made lower-difficulty throws, but
he targeted shallow routes at a rate comparable to the other two. Although Lock
(8.8) and Jones (8.2) had higher ADOTs, their throws traveled five yards or
less at virtually the same rate as Haskins:
Quarterback
Shallow Throw Rate
Haskins
48.5%
Jones
48.4%
Lock
47.4%
Perhaps this is more symptomatic of a concern about Haskins’ mechanics as they pertain to the deep ball. However, our metrics indicate that he was still one of the better passers in the nation at throwing catchable balls to depths of at least 20 yards. Out of 151 college quarterbacks who threw 20 or more such passes in 2018, Haskins ranked 15th at 65%.
That’s a hair better than Alabama’s Tua Tagovailoa, who is, for all intents and purposes, the incumbent 2020 QB1. It also represents a substantial demarcation from Jones, who ranked 47th at 57%. That said, he ranked lower than Lock, whose biggest selling point may be his vertical passing acumen. The Missouri signal-caller ranked 6th in the country by throwing a catchable deep ball 68% of the time.
By this point, you’ve probably noticed that Jones doesn’t
compare favorably to his counterparts, and his case is a curious one. First and
foremost, it should be noted that he played most of the season with a plate and
screws in his left clavicle to fuse together a broken collarbone he suffered on
September 8. Nevertheless, the Blue Devil captain played himself into first
round consideration and is regarded by some as the most pro-ready quarterback
in the draft. However, the numbers don’t necessarily back that assertion up.
Jones was primarily asked to execute 0/1-step drops, RPOs, screens, and rollouts, concepts that generally indicate simpler, or even singular, reads. He did so on a whopping 73% of his dropbacks, the eighth-highest rate among 164 quarterbacks who dropped back at least 100 times in 2018.
To give you an idea of how that might translate to the NFL, Nick Foles had the highest rate of 43 NFL quarterbacks at 58%. Only two other quarterbacks did so at a rate above 50%. The average rate among quarterbacks who dropped back at least 100 times was 34%.
Fit will be important for all of these quarterbacks, but it seems that Jones’ projection requires a bigger leap of faith than the others. Whereas the numbers can point to ways in which Haskins and Lock win, the statistical picture for Jones is cloudy. For a more in-depth look at each of these quarterbacks, the aforementioned Football Rookie Handbook has comprehensive stats and scouting reports on each and can be purchased at this link.
The combine is a distant memory, pro days are all but over, and it seems all that’s left to do is twiddle our thumbs as teams make their final preparations for the NFL Draft. But, arguing amongst ourselves about quarterbacks is a rich tradition, so perhaps that is the best way to occupy our time as we countdown to April 26th. From an analytical perspective, the search for QB1 begins and ends with Kyler Murray, who dominated the advanced stats leaderboards in our inaugural Rookie Handbook. Murray is widely expected to go first overall to the Arizona Cardinals, but prognosticators are less certain about how the rest of the chips will fall.
Three other quarterbacks – Ohio State’s Dwayne Haskins, Missouri’s Drew Lock, and Duke’s Daniel Jones – are also receiving first round consideration, and there’s no shortage of potential landing spots. The Giants, Broncos, Bengals, Dolphins, and Redskins are franchises with long-term uncertainty at the position who pick within the top half of the first round.
From an Expected Points Added (EPA)/attempt perspective, Haskins (0.3) is head and shoulders above Lock (0.13) and Jones (-0.04). He’s also considerably more accurate, having delivered an on-target ball on 77% of his throws in 2018, whereas roughly 30% of passes thrown by Lock (71.4%) and Jones (71.6%) were uncatchable or required an adjustment.
Haskins’ detractors will point to his low average depth of target (ADOT) of 7.9 yards and cite that he made lower-difficulty throws, but he targeted shallow routes at a rate comparable to the other two. Although Lock (8.8) and Jones (8.2) had higher ADOTs, their throws traveled five yards or less at virtually the same rate as Haskins:
Quarterback
Shallow Throw Rate
Haskins
49.1%
Jones
49.2%
Lock
48.6%
Perhaps this is more symptomatic of a concern about Haskins’ mechanics as they pertain to the deep ball. However, our metrics indicate that he was still one of the better passers in the nation at throwing catchable balls to depths of 20+ yards. Out of 151 college quarterbacks who threw twenty or more such passes in 2018, Haskins ranked 15th at 64.9%. That’s notably a tenth of a percentage point better than Alabama’s Tua Tagovailoa, who is, for all intents and purposes, the incumbent 2020 QB1. It also represents a substantial demarcation from Jones, who ranked 47th at 56.8%. That said, he ranked lower than Lock, whose biggest selling point may be his vertical passing acumen. The Missouri signal-caller ranked 6th in the country by throwing a catchable deep ball 67.8% of the time.
By this point, you’ve probably noticed that Jones doesn’t compare favorably to his counterparts, and his case is a curious one. First and foremost, it should be noted that he played most of the season with a plate and screws in his left clavicle to fuse together a broken collarbone he suffered on September 8th. Nevertheless, the Blue Devil captain played himself into first round consideration and is regarded by some as the most pro-ready quarterback in the draft. However, the numbers don’t necessarily back that assertion up.
Jones was primarily asked to execute 0/1-step drops, RPOs, screens, and rollouts, concepts that generally indicate simpler, or even singular, reads. He did so on a whopping 72.6% of his dropbacks, the eighth-highest rate among 164 quarterbacks who dropped back 100+ times in 2018. To give you an idea of how that might translate to the NFL, Nick Foles had the highest rate of 43 NFL quarterbacks at 58.3%. Only two other quarterbacks did so at a rate above 50%, and the average rate among quarterbacks who dropped back at least 100 times was 33.8%.
Fit will be important for all of these quarterbacks, but it seems that Jones’ projection requires a bigger leap of faith than the others. Whereas the numbers can point to ways in which Haskins and Lock win, the statistical picture for Jones is cloudy. For a more in-depth look at each of these quarterbacks, the aforementioned Rookie Handbook has comprehensive stats and scouting reports on each, and can be purchased here.
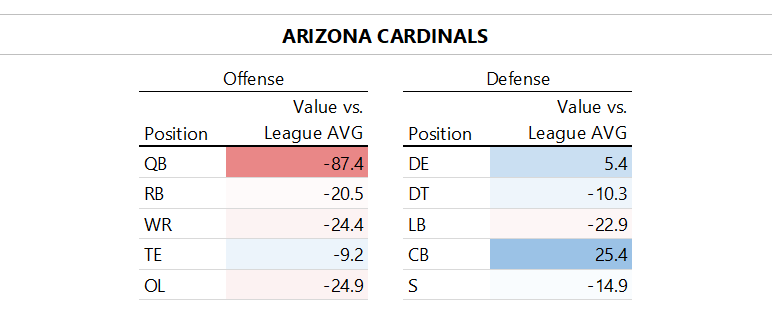
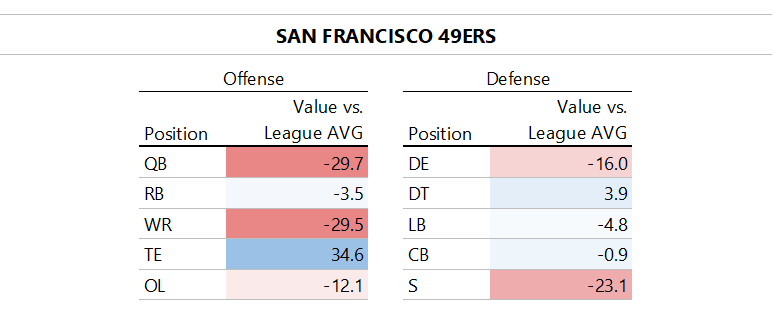
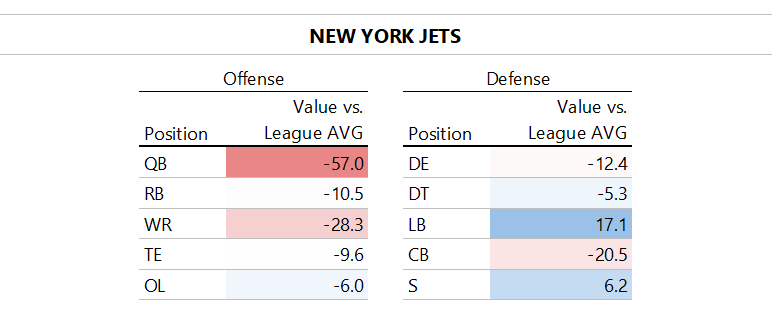
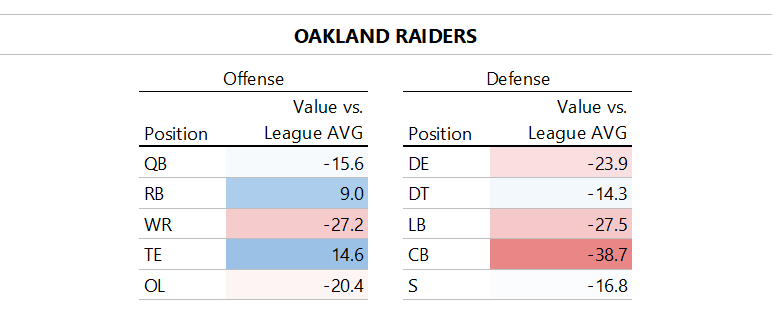
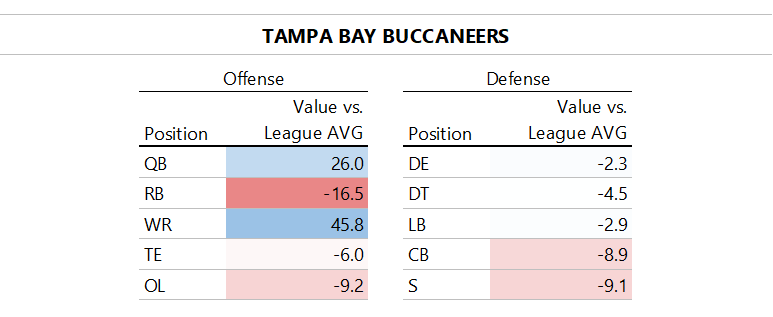
With the free agency finally slowing down, all eyes are turning towards the draft. With that in mind we looked at how teams at the top of the draft have used free agency to bolster their records, and how it may affect their decision come draft day. Team need charts are based on SIS’s unique Total Points metric compared against the league average at each position.
Biggest acquisitions:
The Cardinals have been relatively busy already this offseason, but have yet to make a splash signing. Terrell Suggs and Jordan Hicks were arguably the two biggest signings for the team, both signed in an attempt to bolster a linebacker unit that struggled in 2018.
Hicks was solid against the run in 2018, but struggled in the pass game. On 28 targets Hicks allowed 22 catches for 271 yards and a touchdown. A QBR against of a little bit over 100. Using Total Points, Hicks ranked as the 98th best linebacker in pass coverage among players with at least 10 targets.
The soon-to-be-37 years old Suggs, while listed as a linebacker, will slot in on the edge, and despite his age he should still be able to add value to a pass rushing unit that actually fared pretty well in 2018.
Additional signings:
In terms of weapons for whoever the QB is in 2019, the Cardinals signed TE Charles Clay, TE Ricky Seals-Jones, and WR Kevin White, a rather uninspiring trio for a team lacking weapons and moving into a Kliff Kingsbury offense in 2019. The Cardinals also added a couple of offensive linemen in Max Garcia and Marcus Gilbert and defensive lineman Darius Philon.
What to expect in the draft:
The speculation of Murray to the Cardinals seemingly won’t go away, and while Rosen’s rookie season was nothing short of a disaster, it seems crazy to think they would move on from him only one year removed from moving into the top 10 to select him.
Compounding the intrigue, Cardinals defensive ends were one of only two position groups that put up numbers above the league average in 2018. Outside of Murray, the only player’s who have been mocked at the top of the draft are pass rushers, namely Nick Bosa and Josh Allen. Either of those players would provide an immediate impact and be an upgrade over current Cardinals pass rushers, but it still makes the pick all the more interesting.
Biggest acquisitions:
It has been a relatively quiet offseason so far for the 49ers outside of sending second round pick to Kansas City for Dee Ford, adding a star player in a position of need.
Ford was a force in 2018, generating 13 sacks and 72 pressures, good for 9th and 2nd best respectively. Additionally, his 6 forced fumbles also tied with J.J. Watt for the lead league. Overall, Ford was far and away the top rated pass rusher by Total Points 2018 with 37.7 Points Earned, outpacing the like of Frank Clark, Aaron Donald, and J.J. Watt.
The 49ers also gave a massive 4 year deal to former Bucs linebacker Kwon Alexander, worth $54 million, including $25.5 million guaranteed. Alexander is a young high upside linebacker, but is coming off of a torn ACL. The 49ers are betting he can return to his 2017 form when he had 96 combined tackles, including 6.5 for a loss.
Additional signings:
The 49ers did also add another playmaker to their offense in Tevin Coleman. The 49ers were able to get solid production from a committee of running backs last season, namely Matt Breida, Alfred Morris and Raheem Mostert. Coleman will join a crowded but talented backfield, including a newly healthy Jerrick McKinnon.
What to expect in the draft:
The 49ers will have their fingers crossed hoping that the Cardinals take Murray with the 1st overall pick, allowing them to take whoever is on the top of their big board. 49ers GM John Lynch has made it clear he plans to take the “best player available”.
That “best player” is very possibly another pass rusher to go alongside Dee Ford. Nick Bosa or Josh Allen lining up opposite of Ford would quickly turn an impotent pass rush from last year into one of the more dangerous tandems in the league.
Defensive tackle was also a position of weakness for the 49ers last year, and the recent acquisition of Ford may allow the 49ers to select Quinnen Williams, a player many view as the best in the draft (including our rookie handbook). The Outland Trophy winner was dominant against the run, leading the nation in tackles for non-positive yards, and his hurry rate when pass rushing was also far and away the best among college defensive tackles.
Biggest acquisitions:
The Jets have been among the biggest spenders in free agency this season, most notably inking Le’Veon Bell to a four-year deal. Bell’s year off certainly adds some question marks, but it seems more likely than not that Bell will again find himself among the best at the position. Our Bryce Rossler took a deeper dive on what Bell does well earlier this offseason.
The Jets also added LB C.J. Mosley. The former Raven was productive over the course of his rookie contract, particularly against the run. In 2018 Mosley had 101 combined tackles, including 4.5 for a loss. Mosley did struggle in pass coverage in 2018 though, allowing a QBR against of 100 on 39 targets. By SIS’s Points Saved metric Mosley ranked as the 40th best linebacker in pass coverage this past season.
Additional signings:
Some other notable transactions for the Jets include WR Jamison Crowder, who they are hoping can turn into a reliable target for Sam Darnold, and also WR Josh Bellamy.
What to expect in the draft:
After selecting their franchise QB in last years draft, the Jets will likely be taking the “best player available” approach with the No. 3 pick. This would likely be one of Nick Bosa, Josh Allen, or Quinnen Williams, all of whom would provide tremendous value at positions of need.
It is also likely that the Jets will be fielding offers from QB-needy teams, especially if Murray slides past the Cardinals. This could allow the Jets to recoup some of the assets they parted ways with last year to get Darnold, and depending on the suitor could still leave them in position to get either Greedy Williams or Deandre Baker. Gaining assets while also grabbing the best player at arguably their biggest position of need may be the best case scenario for the Jets.
Biggest acquisitions:
After trading away Khalil Mack and Amari Cooper during the season, it appeared the Raiders were entering a lengthy rebuilding period. By trading for Antonio Brown they made it abundantly clear that was not the case. Brown immediately slots in as the best playmaker on the team, and the number one option for Derek Carr. I have already done a more detailed analysis on this trade here.
The Raiders also gave a record setting contract to offensive tackle Trent Brown, fresh off a Super Bowl win and the best season of his career. By Total Points, Brown was the 4th highest rated offensive lineman, and was especially strong pass blocking, earning 4.4 of his 5.7 Points in the pass game.
Additional signings:
The Raiders also added more talent to their wide receiving core by adding the speedy Tyrell Williams, who should find himself as their No. 2 option. LaMarcus Joyner was also brought in to help bolster the secondary, and more recently the Raiders added LB Vontaze Burfict.
What to expect in the draft:
Even after a busy start to the offseason, the Raiders have needs just about everywhere. They also conveniently have three picks in the first round this year. While their have been fun rumors about Kyler Murray throwing to Antonio Brown, it would be surprising to see them do anything other than replace the Khalil Mack-sized hole in their pass rushing unit. Depending on what happens in the first three picks this may mean one of Montez Sweat or Clelin Ferrell, but a run on quarterbacks at the top of the draft could certainly shake things up.
Biggest acquisitions:
Because of cap concerns, the Bucs have been forced into an uneventful offseason. The honor of being their biggest signee likely belongs to LB Deone Bucannon.
Bucannon played well in his time under Arians in Arizona, and now get’s a chance to be re-united with the coach who made him a first round pick in 2018. A converted safety, Bucannon will likely play a similar hybrid type role that he flourished in during his time in Arizona. In 2017 (his last season with Arians), he had 82 combined tackles, allowed a QBR against of only 76 on 44 targets, limited quarterbacks to 5.6 yards per attempt, and scored two defensive touchdowns.
Additional signings:
Outside of Bucannon, the Bucs have mostly looked to add depth. Other signings for the Bucs include S Kentrell Brice, G Earl Watford, and LB Shaqil Barrett.
What to expect in the draft:
By Total Points, the Bucs weaknesses aren’t quite as glaring as the rest of the top 5, but this is at least in some respects due to some Fitz-Magic early in the season. It is also worth noting that the future of their star defensive tackle, Gerald McCoy, is up in the air as the Bucs currently don’t have the cap to sign their upcoming draft picks.
Whether or not the Bucs are able to retain the services of McCoy will likely play a huge role in who they take with the number 5 pick. It is not impossible that Quinnen Williams is still their for the taking, and he would provide a solid, and more importantly, cost controlled, consolation for the loss of McCoy.
Two potential positions of need for the Bucs are at cornerback and on the offensive line. If the top of the draft goes as expected they will have the luxury of taking whoever is on the top of their board at either of the those positions, if they decide to go that route.
On the offensive line this would likely mean a debate between Alabama product Jonah Williams, or the incredibly athletic Jawaan Taylor. At corner, DeAndre Baker and Greedy Williams sit atop our big board. All four could provide an immediate impact for the Bucs in 2019.
The Bucs pick could also be a prime target for teams looking to make a move for a sliding QB. Projecting what Dave Gettelman will do at No. 6 is tricky, but the Giants taking a QB seems like the most likely outcome. A team like Washington or Cincinnati my need to jump to No. 5 if they want to grab their franchise QB in this draft.
During the Ted Thompson era in Green Bay, the Packers were notoriously inactive in free agency. That trend has changed under second year General Manager Brian Gutekunst. Will that help maximize Green Bay’s contending window?
This off-season alone, Gutekunst has already handed out contracts worth a total of $182 million per Spotrac. For comparison, Thompson handed out only $77.5 million worth of contracts over his last 7 years as GM combined. Gutekunst’s signings so far have been focused on defense, as he’s signed safety Adrian Amos and edge rushers Preston Smith and Za’Darius Smith, while also signing offensive lineman Billy Turner.
The three defensive signings should immediately fill positions of need, and importance, for the Packers. That is always a good thing for a team with an aging quarterback. But is spending on large free agent contracts now better than their previous draft and develop strategy?
With four draft picks in the top 75 selections and a draft loaded with pass rushers, it might seem like the Packers overspent on the two Smith’s in free agency. However, when analyzing how edge rushers at different points in their careers perform based on SIS’s Total Points metric, Green Bay probably made the right move to maximize its contending window.
How Edge Rushers and Safeties of Different Tenures Perform in the NFL:
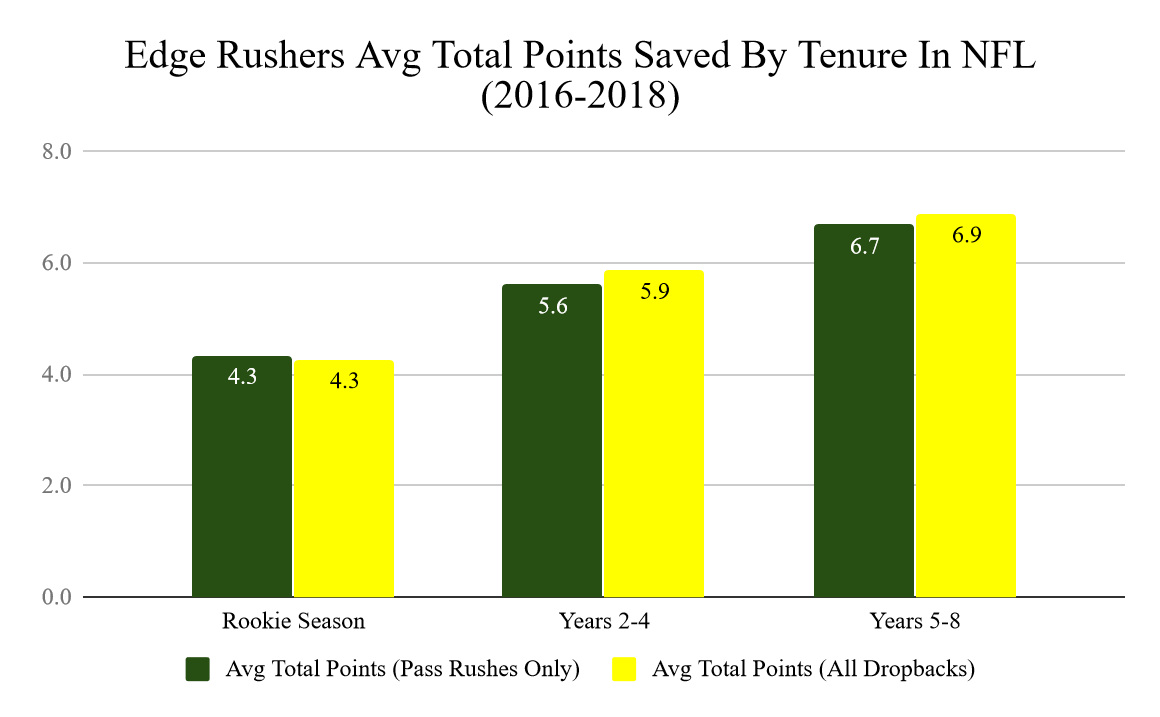
We analyzed how edge rushers performed over the past three seasons based on how many years they have been in the NFL. Only edge rushers (DE or LB who rushes at least 70 percent of his snaps) who had at least 100 pass play snaps in a given season from 2016-2018 were included. Their performance was broken up by two major milestones in a player’s development and contract situation.
The first grouping only includes a player’s rookie season since rookies generally have a learning curve to adjust to from college. The second group is second through fourth year players. The third group is fifth year through eighth year players. This group is made up of players who are mainly playing on their second contract.
In looking at the average Total Points Saved that edge rushers create, there is an unsurprising positive jump after a player’s rookie season. There is also a positive jump as they enter into their second contract.
This doesn’t mean that free agency is a better way to build a team, especially once finances are included into the equation. It also doesn’t mean that players linearly improve as they age—there are survivor biases to consider when comparing rookies to eighth-year players. It just means that teams can generally expect more immediate results from older players that have proven they can perform in the NFL. And if the Packers are looking to maximize Aaron Rodgers’ prime seasons, that’s a big factor.
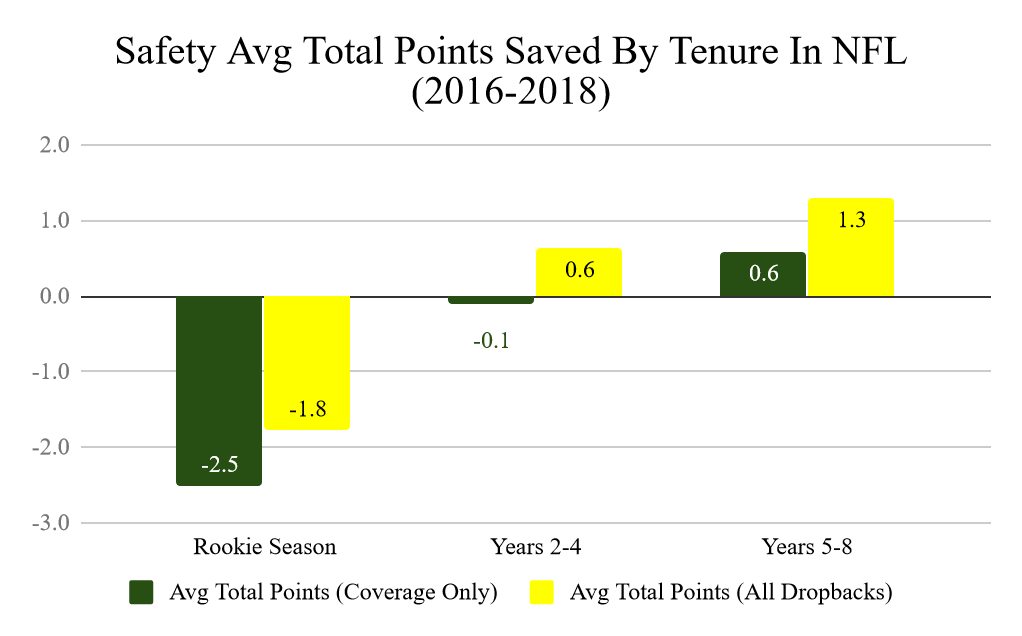
The same analysis was applied to safeties, with only safeties who played at least 100 pass play snaps in a given season from 2016-2018 included. The results show the same trend of a positive jump after a player’s rookie season and a second jump after a player’s fourth season in average Total Points Saved.
Both of these tables bode well for the Packers’ need for immediate impact players on defense. They show that safeties, such as Amos, and edge rushers, such as the two Smith’s, who make it too their second contract perform better on average than younger players and rookies.
How Adrian Amos, Preston Smith, and Za’Darius Smith will Help the Packers:
How their positions perform by tenure is not the only positive for the Packers when analyzing the signings of Amos and the two Smith’s.
Last season the Packers ranked 26th in EPA allowed per designed pass play (pass plays plus scrambles and minus screens). This was primarily due to their inability to create pressure on opposing quarterbacks and their below-average safety play. That is a major problem for a team that played the 4th-most man coverage and blitzed the 7th most in 2018. Teams with those tendencies need to have good pass rushers and reliable safeties on the back end to clean up plays.
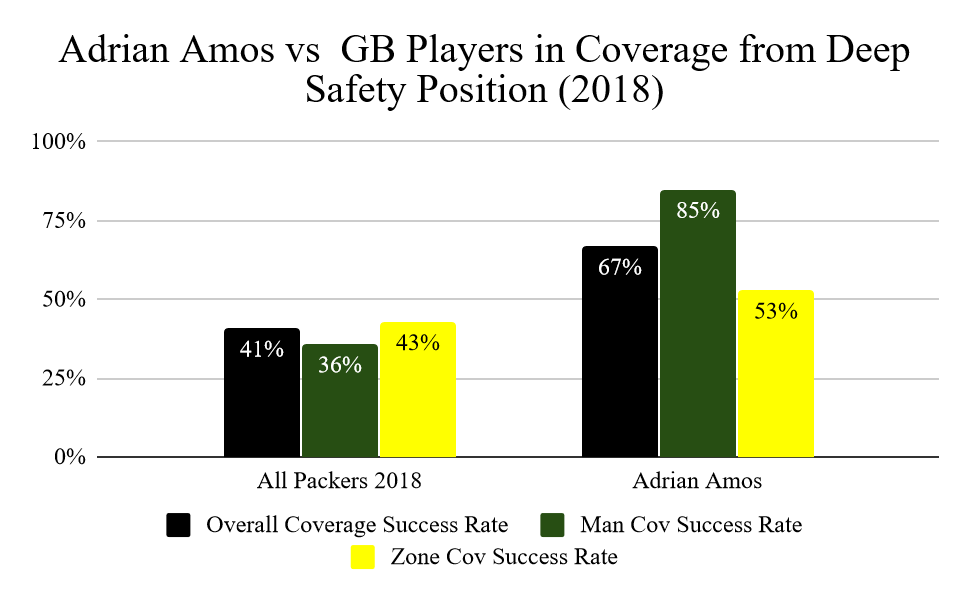
Packers players ranked 27th in Coverage Success Rate (41%) when lined up at safety. (Coverage Success Rate is the percent of targets that result in a negative EPA for the Offense )
The Packers defense ranked 24th in Pressure Percentage on non-blitz plays (25%)
Only one Packer defender with at least 100 pass rushes had a pressure percentage of at least 10%, and that was interior defensive lineman Mike Daniels.
Adrian Amos:
Ranked 2nd in Coverage Total Points Saved (27) among safeties in 2018
Ranked 3rd in Coverage Success Rate (67%) on targets from the safety position among defenders targeted at least 15 times.
Ranked 1st in Man Coverage Success Rate (85%) on targets from the safety position among defenders targeted in man coverage at least 7 times.
Preston Smith and Za’Darius Smith:
Both have had a Pressure Percentage of at least 10% each of the last two years.
Za’Darius Smith (11%) and Preston Smith (10%) would have ranked 1st and 2nd, respectively, in Pressure Percentage among Packers edge rushers last season.
Preston Smith ranked 3rd in Pass Rush Total Points Saved among LB in 2017 with 23. He had 15 Pass Rush Total Points Saved in 2018, which was more than double the most by a Packers edge rusher.
The Packers’ need to maximize the window they currently have with Aaron Rodgers at quarterback. Going into free agency they targeted defensive players that could help them right away, while also still having some upside. They came away with Adrian Amos, Preston Smith, and Za’Darius Smith on that side of the ball.
Even though they come with large contracts, the statistics and Total Points by tenure analysis show that these signings have a good chance of working out. So although the draft and develop strategy is generally thought of as more efficient, signing free agents can be a good way to supplement a roster with immediate impact players.
For the Packers, it also doesn’t hurt that they still have plenty of draft capital to continue a draft and develop strategy for the future.
The NFL passed a rule change at its owners meetings to make pass interference a reviewable call. In light of the development, we wanted to share a newsletter that we sent to our NFL team partners earlier this year.
After what can best be described as a controversial end to the season, both pass interference (PI) and the current instant replay system are at the forefront of conversation this NFL offseason. With this in mind, SIS looked at which penalties are the most influential over the course of a game, and specifically which penalties might warrant being included in the NFL’s review process moving forward.
SIS’s charting
data includes detailed information about penalties, reviews, receiver
participation and route information, and was analyzed in terms of both Expected
Points and actual Net Drive Points. The goal was to see both the expected and
actual impact of different penalties on the game, the different factors that
can drive those penalties, and how those plays compare overall to plays
reviewed under current NFL rules, namely touchdowns, turnovers, and
receptions.
Using Expected Points to Evaluate the Impact
of Penalties
From 2016 to 2018
an offensive touchdown was worth an average of 2.03 Expected Points. While this
seems low, it is worth reiterating that for a clear majority of touchdowns,
most of the value comes in the plays preceding the score, as opposed to the
scoring play itself. Turnovers, on the other hand, are among the most impactful
events during a game, costing the offense 3.97 Expected Points on average,
almost twice the value of the average touchdown.
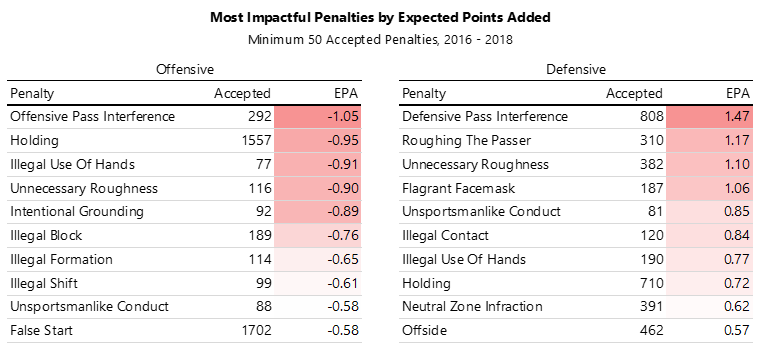
For comparison,
all accepted penalties from the last three seasons were analyzed, and the 10
most impactful penalties by EPA for each side of the ball are shown below:
On the defensive
side, pass interference is not only the most common penalty, but also the most
substantial based on Expected Points. On average, defensive pass interference
(DPI) nets the offense an additional 1.47 Expected Points. While this is not
quite on par with a scoring play or a turnover, it outpaces the next closest
defensive penalty by about a third of a point, and the most severe offensive
penalty by almost half a point.
While this
analysis primarily focuses on the defensive side of the ball, it is still
notable that offensive pass interference (OPI) has the most severe impact of
any offensive penalty with -1.05 EPA. It is called far less frequently than its
defensive counterpart, but, when called can play a large role in shaping a
drive or game, and it separates itself from the other more common offensive
penalties.
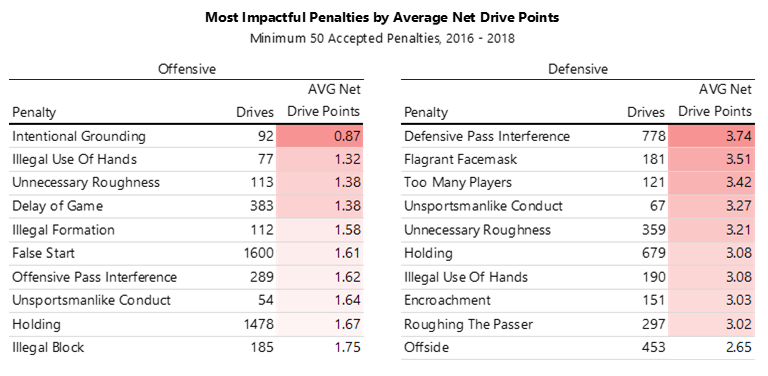
Using Net Drive Points to Evaluate Penalties
Another way to
look at this data is through the lens of Net Drive Points. Net Drive Points are
the eventual points scored on each drive, including negative points for
defensive touchdowns. From 2016 to 2018 the average offensive drive netted 1.62
point. To quantify how much each penalty can jump-start or stall a drive,
drives results were grouped by penalty type. Again, the top 10 penalties for
each side of the ball are listed below:
When
comparing the Net Drive Points for penalties it is important to understand the
relationship between the length of drives and the likelihood of penalties.
The
average drive that did not have a penalty was 4.9 plays long, compared to 8.3
for drives with a penalty. This is obviously not an indication that offensive
penalties extend drives, but simply that the more plays you run, the more
likely you are to take a penalty. With that in mind, the numbers for Net Drive
Points are slightly inflated, but still allow us to see which penalties had the
greatest impact on overall drive results.
DPI
was the most drastic, adding well over two points to the average drive, and was
about a quarter of a point higher than the second highest penalty.
Additionally, DPI occurred on 778 unique drives in the last three seasons, more
than any other defensive penalty, and was outdone only by holding and false
start on the offensive side.
Comparing
offensive and defensive penalties, almost all the most significant penalties
occur on the defensive side of the ball. The only offensive penalty that
rivaled the severity of a defensive penalty in terms of Net Drive Points was
intentional grounding, which includes both a loss of yardage and a loss of
down.
DPI as a Function of Play Calling
There are a few
factors that drive the increased impact of defensive penalties, the strongest
being that automatic first downs add a lot of value for the offense. When
looking at the overall EPA of penalties by down, this becomes very clear.
The average EPA
of a defensive penalty on first down is 0.64, but it doubles to 1.28 when the
penalty occurs on third down. This is likely a result of large EPA swings when
an offense is awarded a first down in third-and-long situations.
Further
illustrating this, the impact of offensive penalties remains consistent
regardless of down, with first, second, and third down having EPA values of
-0.77, -0.81, and -0.75, respectively.
Most importantly,
there is evidence that—at least on some level—offenses can force the defense
into penalties. Specifically, targeting vertical routes leads to more PI
calls.
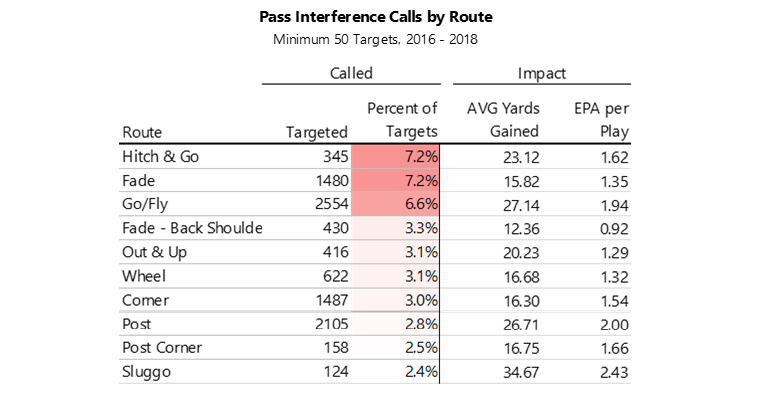
When breaking down which routes are most likely to draw DPI, three routes stand out: hitch and go, fade, and go/fly. All three routes drew pass interference on about 7% of targets. No other route drew DPI on more than 3 percent of targets. The top 10 routes by their ability to draw DPI are shown below:
Not surprisingly,
the routes that stretch the field vertically put the most stress on defenders
and lead to the most pass interference calls. The average throw depth of a play
with DPI is 19.7 yards, about 8 yards higher than the average reception that
results in a review (11.8) and more than 10 yards higher than the average throw
(8.5).
Therefore, teams
that stretch the field, especially in high-leverage situations such as third
downs, would also be more likely to benefit from pass interference calls.
The go/fly also
stands out in terms of impact. It is not only among the most likely to draw a
DPI, but it also gains an average of 27.14 yards when flagged, well over double
the average reviewed catch, and has an EPA of 1.94, just shy of the average EPA
of a touchdown. The post and sluggo route draw DPI less frequently but have a
similar impact when called.
Final Thoughts
While DPI did not prove to be as impactful as scoring plays or turnovers by EPA, it did still stand out amongst penalties. DPI was a third of a point higher than any other penalty in terms of EPA and was also the most accepted defensive penalty. On the other side of the ball, offensive pass interference was the most impactful offensive penalty.
DPI also stood out in terms of Net Drive Points. Offenses scored an additional two points per drive on average when DPI was called. This ranked it as the most severe penalty overall, about a quarter of a point higher than the next penalty, all while occurring on the most unique drives among defensive penalties. (Only holding and false start occurred more often overall.)
Another important
finding is that offenses can play a role in defensive penalties. There were
three routes that stood out in their ability to draw DPI: hitch and go, fade,
and go/fly.
High yardage penalties, coupled with the impact of automatic first downs can lead to large swings in games, particularly when it is called in third down situations. Pass interference warrants inclusion in the NFL’s review system. The above analysis shows that PI is at least as impactful as plays that can currently be challenged, specifically receptions, and are among the most impactful plays in the game.
The league season is still a few hours from officially starting, and yet the last week has been among the most chaotic in recent memory. While record-breaking contracts have been given out left and right, the two biggest moves actually came via trade, as Antonio Brown was sent to the Raiders and Odell Beckham Jr. was sent to the Browns.
Odell to the Browns
Browns get: Odell Beckham Jr. Giants get: S Jabrill Peppers, 17th pick, 95th pick
Baker Mayfield excelled last season under then-interim OC Freddie Kitchens. From weeks 9 through 17, Mayfield posted an Independent Quarterback Rating (IQR) of 112.1, the fourth-best rating during that stretch, and a Yards per Attempt (Y/A) of 8.6, trailing only Patrick Mahomes by a tenth of a yard. With Kitchens now the head coach and with Baker having his first full offseason of preparation, that high level of play was already expected to continue into 2019. But now with Beckham in the fold, the Browns’ offense has the potential to be among the league’s most dangerous.
In 2018, Beckham was only targeted on throws more than 15 yards downfield 36 times, a criminally low rate for such a dangerous player. For reference, Julio Jones saw 65 such targets. To make matters worse, Eli Manning ranked 22nd in On-Target% (57.9) and 25th in IQR (81.2) on those throws.
Beckham should expect to be targeted downfield much more often with the Browns. During Kitchens’ tenure as OC, only Aaron Rodgers pushed the ball downfield more consistently than Mayfield. On those throws, Mayfield posted an On-Target% of 62.5 and an IQR 109.7, which ranked as the fifth- and seventh-best marks in the league during that span. Beckham should immediately become Mayfield’s go-to guy downfield, and Jarvis Landry can work the short and intermediate parts of the field where he is more comfortable. (In 2016 and 2017, 33 percent of Landry’s targets came on slants, drags, or screens, compared to only 21 percent in 2018.)
On the other end of the deal, this trade leaves the Giants in a precarious position, even before considering the dead salary cap ramifications. They’re only a handful of years away from owing Barkley a huge pay day, and have managed to trade away most of their young talent, all while not making any real effort to find a replacement for Eli. Maybe their quarterback of the future falls to them at the sixth pick this year, or maybe they use their new first round pick in a package to move up and draft their guy, but it’s hard to see a path to quick rebuild for the Giants.
The Browns also find themselves in an unfamiliar spot: betting favorites in the AFC North. It feels crazy to say about a team that is only two years removed from a winless season, but with a strong cast of skill position players on offense and a couple of young playmakers on defense, the Browns appear to be a legitimate threat in the AFC this year. It is possible that OBJ is the final piece in what has been a remarkably quick turnaround.
Brown to the Raiders
Raiders get: Antonio Brown Steelers get: 66th pick, 141st pick
This time last year, the Steelers were legitimate Super Bowl contenders. They had a future HOF quarterback; Antonio Brown and Le’Veon Bell who were both arguably the best at their respective positions; and young budding talent in players like JuJu Smith-Schuster. Fast forward to now, the Steelers are fresh off of their first playoff miss since 2013, and have managed to turn their two best players into a 3rd round pick, a 5th round pick, and $21 million of dead cap.
The Raiders, on the other hand, appeared to be entering a full on rebuild last year when they shipped their best player off to Chicago, but are seemingly trying to expedite that rebuilding process with this trade. Given the incredibly low price tag and their plethora of draft capital, it is hard to blame them.
Brown provides immediate help for an offense that mostly struggled in its first season under Jon Gruden. Derek Carr was efficient, completing 68.9% of his passes, but struggled to find big plays. His Y/A of 7.3 ranked as only 20th-best among QBs with at least 200 attempts. Despite his age, Brown should provide an immediate impact downfield. On throws of at least 15 yards, Brown turned 52 targets into 614 yards and 9 touchdowns. Raiders receivers as a whole had 1,029 yards and 7 touchdowns on such throws. The Raiders are hoping Brown can turn into the consistent downfield threat they thought they were getting with Amari Cooper.
Brown can also provide additional value in the shallow routes that are the staple of Gruden’s offense. While the Raiders were mostly efficient on these routes last year (they completed 81% of slants), Brown provides the big play threat and YAC ability that the Raiders lacked. Brown’s 8.8 YAC per reception on slant routes last year ranked 2nd in the NFL behind Tyreek Hill. Raiders receivers as a whole averaged only 6.4 YAC per reception, and only 5.3 if you remove Cooper from that equation.
A lot of the Raiders’ success this season will depend on what their three first round picks turn into, but Brown provides a clear boost to an offense lacking in playmakers. He should immediately become Carr’s favorite target and be the focal point of an offense hoping to turn things around this season.
Earlier today, Jason Witten decided to postpone his career in the broadcast booth and return to the football field. He is coming out of retirement for his 16th season with the Cowboys. But will his return be a success and help the Cowboys return to the playoffs and compete for a title?
Witten’s 2017 season (the last season he played) was, by just about every statistical measure, his worst in the NFL since his rookie year. Outside of his rookie year, 2017 saw him produce a career low in receptions, yards, and yards per reception. So it’s fair to wonder how much he has left, especially after spending last season in the booth.
Comparing his stats to the Cowboys’ TE unit from last season also paints a negative picture of his potential value in 2019.
Jason Witten Vs Cowboys’ TE’s in 2018
Season
Player
Rec
Yds
Yds/Tgt
TDs
2016
Jason Witten
69
673
7.1
3
2017
Jason Witten
63
560
6.4
5
2018
All Dal TE’s
68
710
7.8
4
The Cowboys’ TE’s basic stat production was better in 2018 than with Witten in 2016 and 2017. When compared to Witten, the group of Blake Jarwin, Geoff Swaim, Dalton Schultz, and Rico Gathers accounted for a similar number of receptions, more yards, more yards per target, and a similar amount of touchdowns in 2018. It should be noted that during 2016 and 2017 seasons, Witten accounted for 87.5% of the Cowboys’ targets towards a TE and TE’s other than Witten combined for only 19 receptions over those two years. A big factor in this is Witten’s decreased production after the catch as he aged. In 2017, he only averaged 1.7 yards after the catch, while the 2018 group of TE’s averaged 5.5 yards after the catch.
A common narrative surrounding Witten during his last two seasons was that he provided a good safety net for a young Dak Prescott. While this may have been the case, it seems that the 2018 group provided an even better safety net. The table below shows that Prescott’s production when targeting a TE increased in 2018 after Witten retired.
Dak Prescott when targeting a TE
Season
Player
Att
Comp%
On-Tgt%
Y/A
2016
Dak Prescott
105
72.4%
81.9%
7.1
2017
Dak Prescott
97
71.1%
78.4%
6.9
2018
Dak Prescott
91
74.7%
85.7%
7.8
Along with replacing him as a receiver, the 2018 group also did a good job of replacing him as a blocker. In both 2016 and 2017, Witten was asked to block on more plays than any other TE in the NFL. He was solid as a blocker, but the 2018 group of TE’s was even better, blowing only 5 blocks all season.
Season
Player
Blocking Snaps
Blown Block %
2016
Jason Witten
514
1.3%
2017
Jason Witten
488
1.6%
2018
All Dal TE’s
625
0.1%
In 2017, Jason Witten had 17.7 Total Points Earned (SIS’s overall value metric) from his receiving production. Cowboy’s TE’s in 2018 combined for 27.6 Total Points Earned from their receiving production.
Based on the numbers Witten had clearly declined during the last few years of his career, which should be expected of a TE in his late 30’s. So expecting him to provide much of a spark to the Cowboy’s offense in 2019 is a stretch, especially since the group that collectively replaced him has fared pretty well last season.
With the football season over, it’s time to shift attention to the future and the upcoming NFL Draft.
In recent years SIS has tracked NFL and FBS games in a similarly-detailed manner to how it tracks baseball. That allows the company to cover the Draft thoroughly.
This season, SIS Video Scouts combined to chart each FBS game a minimum of four times to track specifics such as formation, personnel, route type, and type of run. The compiled information was supplemented with observations of skills and other critical factors so that players could be evaluated at each position.
Players were graded by Video Scouts on a 1-to-9 scale both in individual skills and critical factors, and then overall among those at their position. If a player’s final grade is 6.5 or higher, he is generally a starting-level NFL player. If a player is graded 7.0 or higher, he is thought to have a Pro Bowl-caliber future. Each scouting report is written by a Video Scout and cross-checked by others in the scout group.
Nine college players graded at least a 7.0 in the inaugural set of rankings. Seven of the players play on the defensive side.
Highest Grades, 2019 NFL Draft-Eligible Players
Name
School
Position
Grade
Quinnen Williams
Alabama
DT
7.4
Ed Oliver
Houston
DT
7.1
Josh Jacobs
Alabama
RB
7.1
T.J. Hockenson
Iowa
TE
7.0
Nick Bosa
Ohio State
DE
7.0
Devin White
LSU
LB
7.0
DeAndre Baker
Georgia
CB
7.0
Greedy Williams
LSU
CB
7.0
Taylor Rapp
Washington
S
7.0
Alabama redshirt sophomore defensive tackle Quinnen Williams earned the highest grade among all players. He was described by the SIS video scout as “an explosively powerful defensive talent, whose rare interior contact balance creates consistent overwhelming backfield chaos, resulting in a next-level force for years to come.”
Statistically speaking, Williams ranked first among SEC defensive linemen with 57 pressures, 43 hurries, and 30 quarterback hits. Not bad for someone who was in his first season as a starter.
Williams’ teammate, junior running back Josh Jacobs, graded out highest among offensive players with a 7.1. The Video Scout’s description noted that “Jacobs plays with elite tenacity, and with his lower-body strength and quick footwork, has the makings of a future star.”
What stood out for Jacobs was that when he ran the ball, good things tended to happen. Jacobs had a positive play percentage of 59 percent, meaning that on 59 percent of his carries, Alabama had an increase in Expected Points Added (EPA). No other running back among those draft prospects who were graded by SIS had even a 55 percent positive play percentage.
These grades and stats can be found in the 2019 SIS Football Rookie Handbook, which will be out in mid-February. More than 250 players are evaluated by the SIS scouting staff, with two pages devoted to each player’s skills and stats. You can learn more about the book and pre-order it at the ACTA Sports website.
It should be unsurprising that both the Rams and Patriots rank highly on offense. Both teams rank in the top ten in both EPA/Called Pass (includes scrambles and excludes spikes) and EPA/Called Run (excludes scrambles and kneel downs). The weakest unit based on average EPA is the Rams’ run defense, which could be in for a long day facing the fifth-ranked Patriots’ rushing offense.
Rams
Rk
Patriots
Rk
EPA/Called Pass
0.18
4th
0.14
7th
EPA/Called Run
0.15
1st
0.07
5th
EPA Allowed/Called Pass
0.03
13th
0.03
12th
EPA Allowed/Called Run
0.02
20th
-0.05
5th
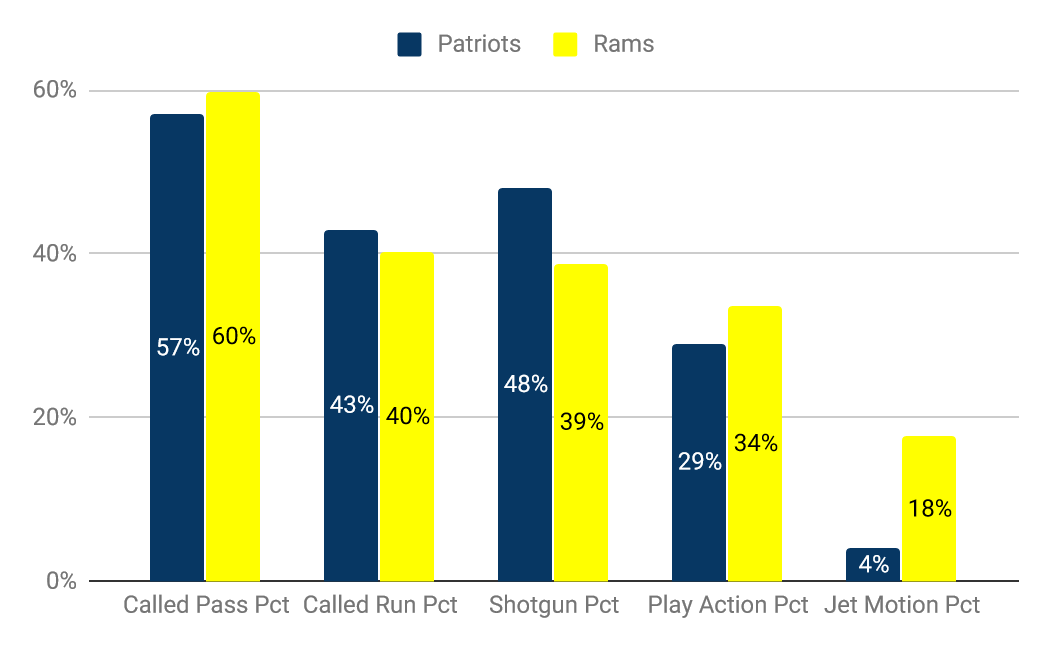
Tendency Report
The Rams and Patriots have similar tendencies based on overall pass/run percentage and the use of shotgun and play-action. Both teams are on the low end of the league in shotgun usage, but they rank highly in play-action usage. One tendency in which they differ is in the use of jet motion. The Rams lead the league by using jet motion on 18 percent of their plays, while the Patriots only use it on 4 percent of plays.
Personnel Usage
The Rams use of 11 personnel (1 RB, 1 TE) since Sean McVay arrived has been well documented over the past two years. They used 11 personnel on 92 percent of their offensive snaps in 2018. However, they started to use 12 personnel (1 RB, 2 TE) a little more often after Cooper Kupp was injured.
The Patriots’ offense also favors 11 personnel, but they mix up their packages much more often. When they are not in 11, they prefer to bring in another running back (usually FB James Develin).
Key Matchups
Patriots’ Short Passing Game vs. Rams’ Pass Defense
The Patriots throw the ball within five yards of the line of scrimmage on 54 percent of their attempts, which ranks 13th-highest. They also target their running backs the second most often in the league.
The Rams’ defense is the best at defending against short passes (5 yards or fewer), only allowing a positive percentage of 38 percent on them.
Patriots’ Guards vs. Aaron Donald
The Patriots’ offense line has been phenomenal this season both in pass protection and run blocking. Their guards, Joe Thuney (1st) and Shaq Mason (8th), both rank highly among all offensive linemen in SIS’s Total Points metric.
Aaron Donald primary lines up in either the 3-technique or 4i-technique in the Rams defense. Teams on average allow pressure (a hurry, hit, knockdown, or sack) from either of these two positions on 9 percent of dropbacks. Donald generates pressure on 16 percent of his pass rushes from these positions.
The Patriots’ offensive line ranks first in the league by allowing pressure from a player lined up at the 3-technique or 4i-technique on only 5 percent of their snaps.
Rams’ Rush Offense vs. Patriots’ Rush Defense
The Rams running game was successful during the regular season, no matter if it was Todd Gurley or CJ Anderson in the backfield. That success followed them into the Divisional Round of the playoffs, but they struggled against the Saints in the NFC Championship. That was due to the Saints having the third best run defense in the NFL, allowing only -0.07 EPA/Called Run Play.
The Patriots have the fifth-best run defense in terms of EPA/Called Run Play, allowing an average of only -0.05. They also rank fifth in run defense versus 11 personnel, still allowing an average of only -0.05 EPA/Called Run Play.
Rams’ Passing Game vs. Patriots’ Man Coverage
The Patriots use man coverage on defense 58 percent of the time, which is the highest percentage in the league.
Unfortunately for the Rams, their best receiver vs. man coverage, Cooper Kupp, is injured. Kupp led the league (min. 10 targets) in yards per target against man coverage with 14.6 yards per target.
Fortunately for the Rams, they still have solid options at receiver. Brandin Cooks ranks sixth averaging 11.9 yards per target against man coverage. Also, TE Tyler Higbee has the third-highest positive percentage of all players (min. 10 targets) against man at 81 percent, albeit on only 11 targets.
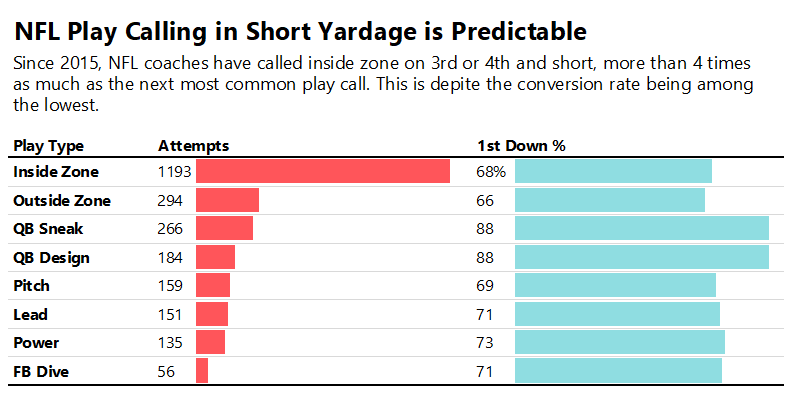
It doesn’t get any simpler than the QB sneak. The offensive line drives straight ahead, the quarterback hides himself behind the center and attempts to fall forward a few feet. It’s far from elegant, but it’s effective. And yet, NFL teams seem unwilling to utilize it.
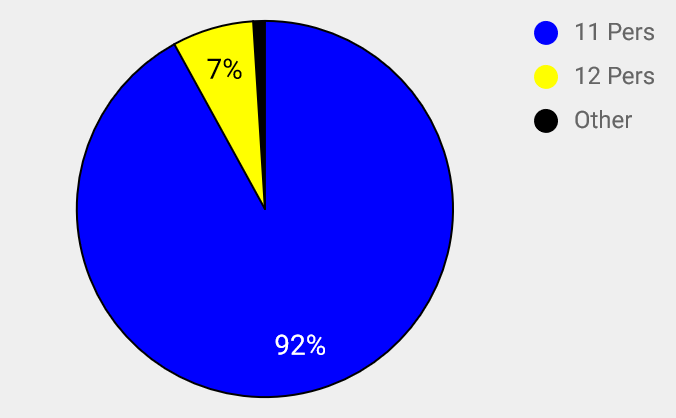
On third or fourth down with a yard or less to go since 2015, teams have called an inside zone (a run up the middle with no pulling lineman or lead blockers) 1,193 times. It’s outside counterpart is a distant second with only 294 attempts. QB sneak ranks third with 266.
Despite being the most commonly run, the inside zone ranks as the second worst play call in terms of first down conversion rate at 68 percent, narrowly edging out the outside zone at 66 percent. By comparison, the QB sneak has a conversion rate of about 88 percent, 20 percentage points better than the inside zone, and 15 percentage points better than the closest play call to a running back.
In theory, based on these numbers, if a team in third- and-1 ran two consecutive quarterback sneaks, they would have approximately a 98 percent chance of converting a first down. This is obviously an imperfect approach, and doesn’t factor in defensive adjustments, but it does help illustrate how baffling it is that teams continue to take the ball out of their QBs hands in these situations.
What’s more, the QB sneak is not an acquired skill, and doesn’t require a particularly athletic quarterback. Since 2015, Blake Bortles, Nick Foles, Drew Brees, and Josh Allen have all boasted perfect conversion rates (Brees has the most successes, 23-of-23). Carson Wentz, Kirk Cousins and Matt Ryan have each failed only once, and no quarterback had a conversion rate lower than the inside zone’s 68 percent.
Increased volume would undoubtedly lead to a decreased success rate, and the list of quarterbacks with a 100 percent conversion rate would likely disappear, but it’s hard to imagine it dropping by 20 percent as a whole.
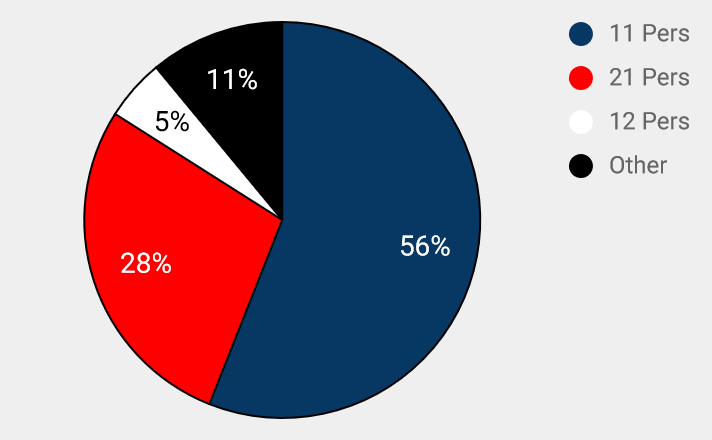
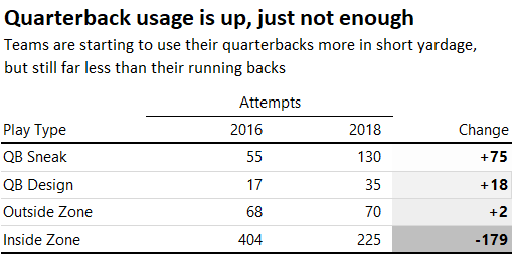
In the defense of teams, the QB sneak has seen a steady increase since 2016, while the inside zone has rightfully seen a sharp decrease. Even still, the inside zone remained the most common play call in short yardage in 2018, outpacing the QB sneak by almost 100 attempts.
The increase in volume showed almost no effect on the performance of the QB sneak. Its success rate in 2018 of 87 percent was only 1 percentage point lower than its 4-year mark. Likewise, the inside zone did not become more effective with it’s decrease in volume, its 68 percent success rate matched its 4-year total. If there is a point where increased volume decreases the effectiveness of the QB sneak, teams certainly haven’t found it yet.
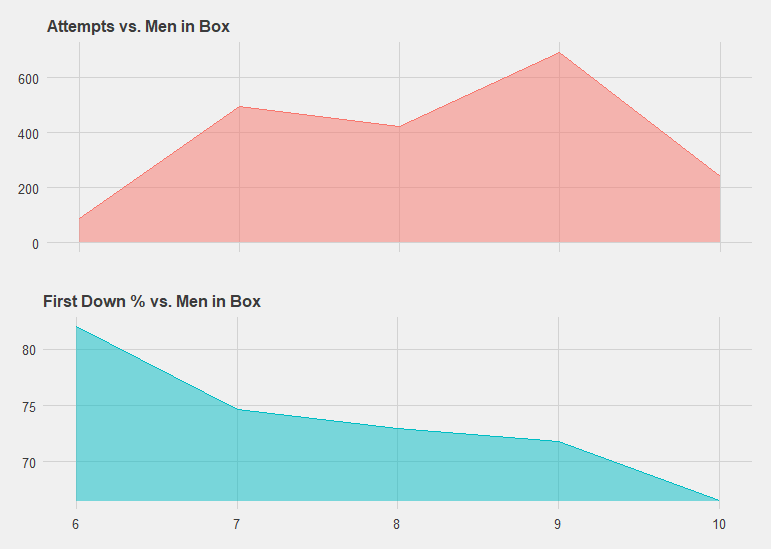
In terms of personnel, teams have also shown a strong tendency towards heavy personnel when it comes to short yardage. To see the effects this has had, we looked at first down conversion rates against the number of players the offense has “in the box”. Men in the box on the offensive side is just a count of how many men are on or near the line of scrimmage, excluding the quarterback.
In similar fashion to the play types, the most effective personnel grouping is also the most infrequently used. The 6-man box, (most commonly a 4-wide set), had a first down conversion rate of 82 percent but was only used 89 times. The 9-man box, most frequently used by coaches at 692, had a conversion rate of only 71 percent.
Intuitively, having more blockers sounds like a good idea, but in practice it just allows the defense to stack the box and bring in heavier personnel, making the job of the lineman that much more difficult. Using spread-type personnel forces the defense to defend the whole field, and also likely forces them to bring in their smaller dime or nickel personnel, and creates better matchups on the interior.
At least until defenses adjust, teams need to start using their quarterback as a weapon more often in crucial short yardage situations, and stop insisting on heavy personnel. Offense as a whole has become more efficient than ever, and it’s time that expands into short-yardage downs as well.