Sports Info Solutions
Category: NFL
-
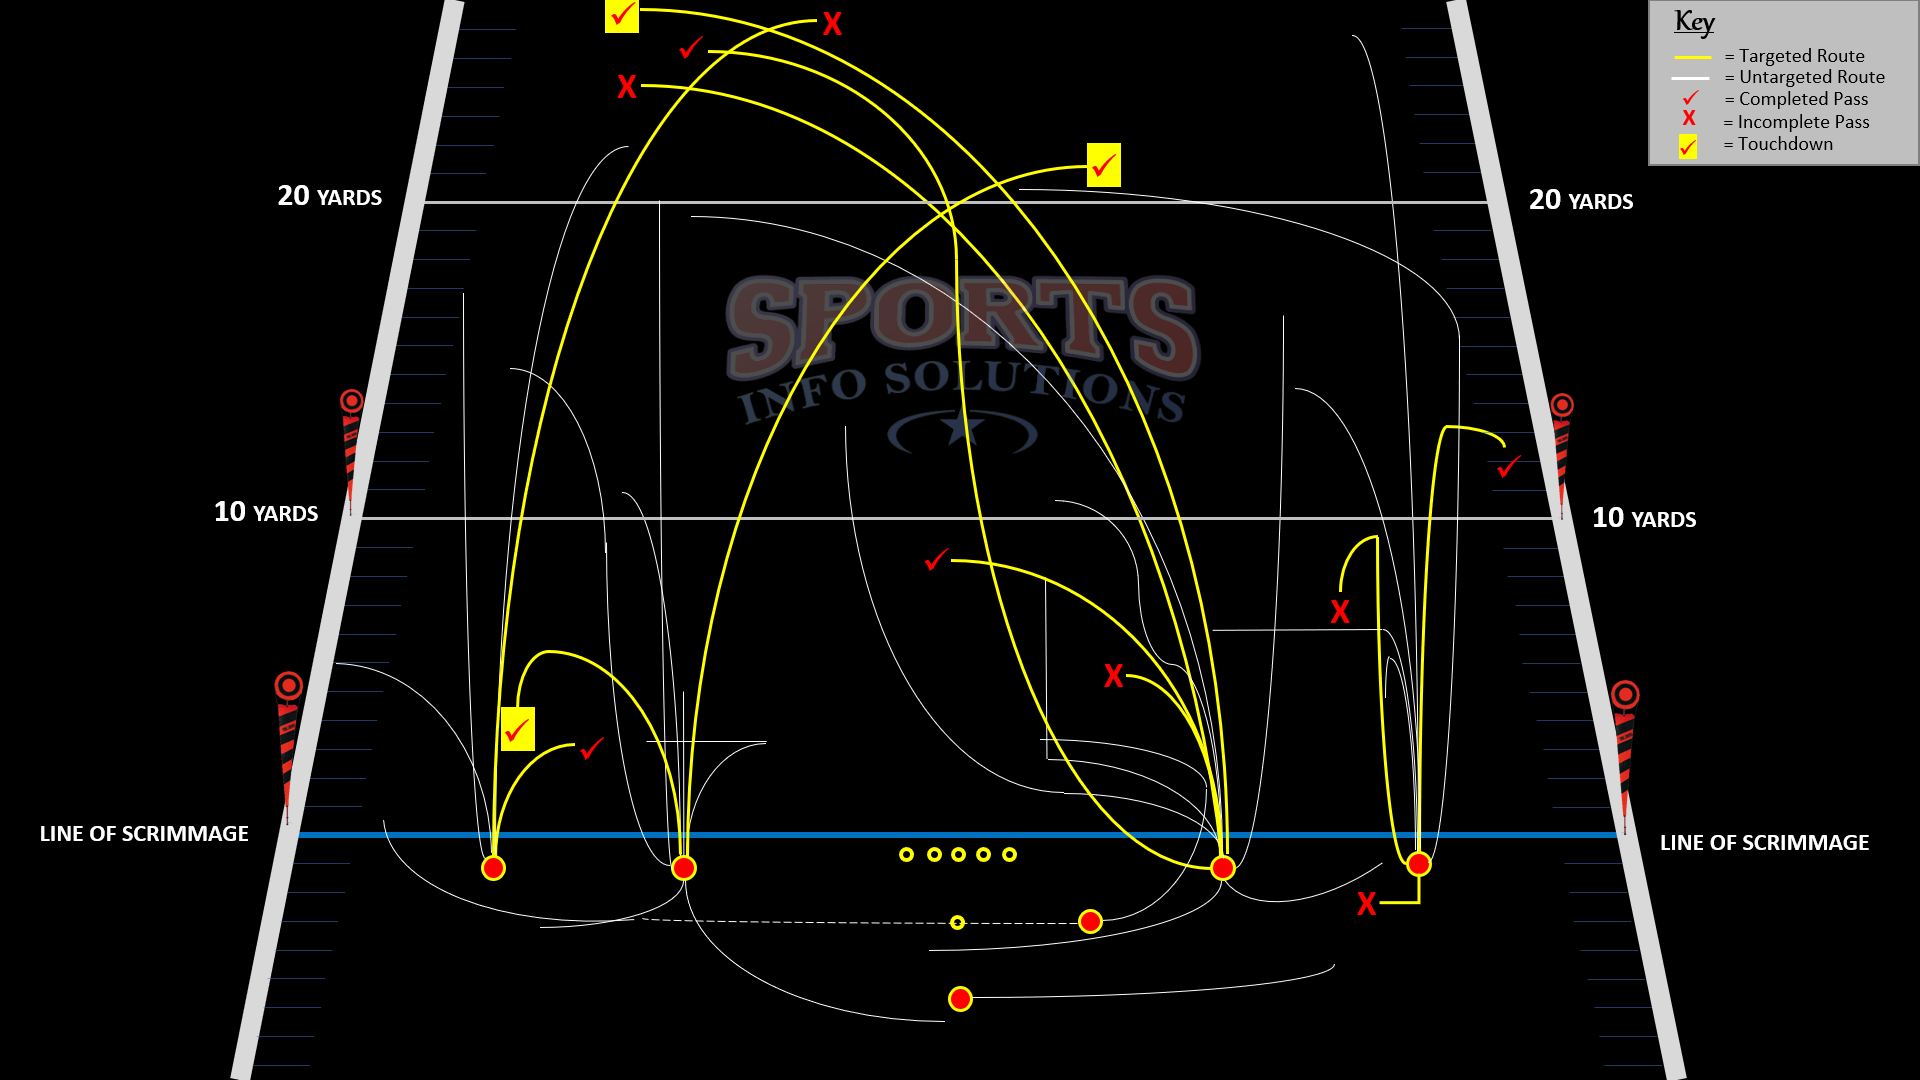
TYREEK HILL: WHAT MAKES HIM SO GOOD?
By
by COREY MARCH Tyreek Hill, or “TyFreak” as he will be referred to from this point forward, is underrated if you ask me. Expected Points Added by WR (when targeted) – 2018 Michael Thomas: 77.3 Davante Adams: 74.0 DeAndre Hopkins: 71.9 Julio Jones: 68.8 TyFreak Hill: 66.4 The thing is, he’s actually “rated” pretty highly…
-
Preview: AFC Championship – Patriots vs. Chiefs
By
On Sammy Watkins’ impact, the Patriots’ offensive line strength and more.
-
Preview: NFC Championship – Rams vs. Saints
By
On the Rams play-action, the Saints use of Michael Thomas and other key stats to know.
-
Aqib Talib should have big impact vs Saints
By
Stopping Michael Thomas figures to be his primary responsibility.
-
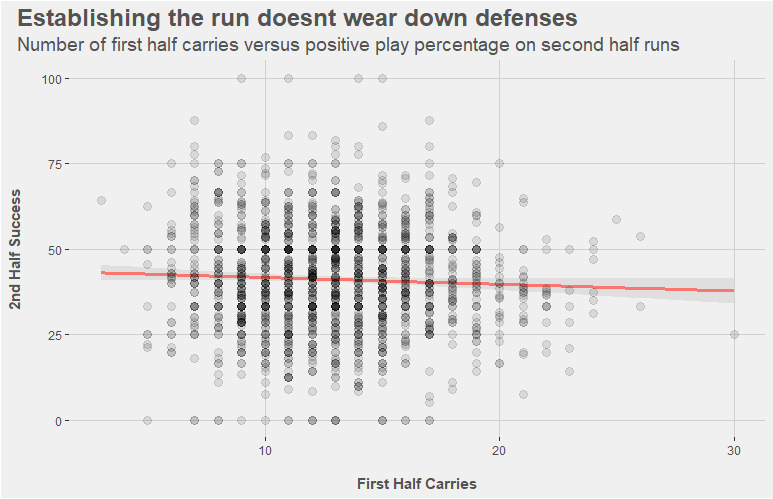
The Rams’ Rushing Success is More Than Just Todd Gurley or C.J. Anderson
By
Scheme usage and avoiding stacked boxes are a big part of their blueprint.
-
A statistical comparison of Outland winners Quinnen Williams and Ed Oliver
By
The advanced metrics seem to favor Williams. We take a closer look.
-
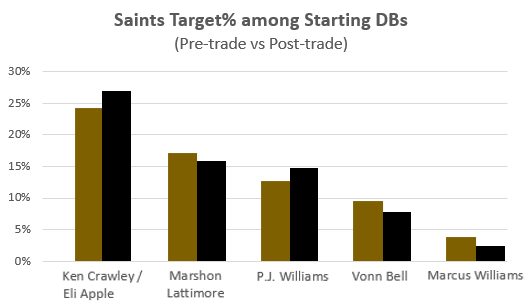
How the Eli Apple Trade Helped Transform the Saints Defense
By
In the first game following their Week 6 bye, the Saints faced a 17-7 deficit heading into the 4th quarter against the Ravens. Thanks to the Saints potent offense, they were able to salvage a one-point win that moved them to 5-1 on the season. Despite the win and the league’s third-best winning percentage, the…
-
Preview: NFC Divisional Round – Eagles vs. Saints
By
Notes on Drew Brees going deep, Nick Foles under pressure, and more.
-
Preview: NFC Divisional Round – Cowboys vs. Rams
By
On Dak Prescott negating the Rams pass rush, Jared Goff vs the zone, and much more.
-
Preview: AFC Divisional Round – Colts vs. Chiefs
By
Notes on Andrew Luck vs the Chiefs pass rush, Patrick Mahomes’ big-play capability and more.